
Anna Coulling of AnnaCoulling.com shares a recent question-and-answer between her and a subscriber about how to grasp a better understanding of reading chart patterns based on volume price analysis (VPA).
Question: Hi Anna—This is my first attempt in understanding the Volume Price Analysis (VPA) after reading your books, appreciate if you could assist me in understanding better the chart based on VPA.
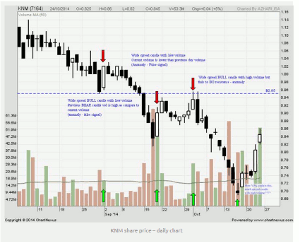
This is on Malaysian stock, Konami Corp. (KNM), how can VPA explain on small spread candle (inverted hammer) with high volume at support area? Attached is the file for your reference.
Really appreciate your assistance.
Click to Enlarge
Answer: Hi—Many thanks for sending me this chart and well done on the analysis you have applied to the chart. I’m so delighted you are using VPA as a trading method, and from what I can see, you have a good grasp of the concepts and principles.
With the regard to your specific question here is my response:
The initial weakness for the stock appears on the left of the chart with the shooting star candle in the 1.14 region associated with high volume and clearly signaling weakness at this level. This initial weakness is duly confirmed with a subsequent shooting star candle, and although the volume is lower than the first and the candle is also smaller, nevertheless, the stock is looking increasingly weak at this price point.
Once the stock breaks below the 104 region then the platform of potential support has been breached and this element of volume price analysis then come into play at this level. The move through 1.00 is confirmed with a wide spread down candle good volume and the share then hints at a possible rally. However, the volume response is weak and in addition the subsequent candles are now testing resistance in the 103 region before rolling over with widening spreads and increasing volume and confirming the bearish sentiment further. The ultra high volume on the 17th is simply confirming the negative sentiment and note there is very little stopping volume here as signaled by the lack of any meaningful wick to the lower body of the candle.
Whilst the share price does indeed rally the next day, the subsequent volume is low, suggesting a lack of meaningful momentum and in addition major reversals rarely occur based on one candle, and certainly without any evidence of stopping volume, this appears to be short covering in preparation for a deeper move lower. In addition, the reversal is also testing resistance in the 0.94 area and the weakness is duly confirmed on the 1st with the high volume up candle and wick to the upper body. The weakness is confirmed again with the price moving lower and finally as the market approaches the 70-80 area we begin to see some sustained stopping volume with narrow spread down candles and high volume.
However, note the final up candle on the chart, which has high volume and a narrow spread candle, suggesting the rally is weak at present and the insiders are not yet ready to reverse the trend just yet. What seems likely is the price may consolidate in this region, with further selling pressure absorbed, and once we see a low volume test following the buying climax, then a reversal from the bearish trend to bullish is likely to develop. For a longer-term view, we would need to consider the weekly and monthly charts for a perspective on where the share price is over these time frames. With regard to the inverted hammer, it is the narrow spread of the candle that is important here and clearly signaling an anomaly with the high volume and further buying by the insiders.
By Anna Coulling, Professional Trader & Blogger, AnnaCoulling.com


