With shares of the energy firm rallying in the wake of positive earnings, see how one trader executed a vertical call spread, or debit spread, to profit from the bullish action.
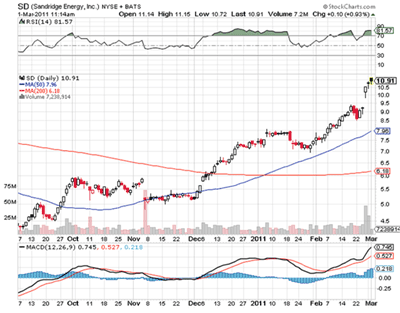
Shares of SandRidge Energy Inc. (SD) had rallied to tag a fresh annual high of $10.91 by Monday morning (Feb. 28) after RBC boosted its price target to $9 per share from $7.
The move follows on the heels of several bullish brokerage notes issued last week in the wake of the company's better-than-expected fourth-quarter earnings report.
Always on the lookout for a stock on the move, options traders have piled into SD calls, with near-term volume of 6,288 contracts nearly tripling the stock's average daily call volume. The most active option has been the March 11 strike, attracting more than 3,200 calls early Monday morning alone.
Taking a closer look at activity on SD's March 11 call reveals a bullish spread position on the security. Specifically, 50 March 11 calls traded at about 9:33 am ET on the Chicago Board Options Exchange (CBOE). These contracts crossed at the ask price of $0.39, or $39 per contract, and were marked "spread."
At the same time, 50 March 12 calls, also marked "spread," changed hands for the bid price of $0.14, or $14 per contract. The end result is a vertical call spread, more commonly known as a debit spread, on SandRidge Energy. This options strategy is also known as a long call spread, or a bull call spread.
The Anatomy of a SandRidge Energy Vertical Call Spread
Breaking down this debit spread position, the trader purchased 50 March 11 calls for the ask price of $0.39, resulting in a debit of $1,950 [(0.39 x 100) x 50]. In the absence of the premium received by selling the March 12 call, the trader would need SD to rally roughly 8.2% from Friday's close at $10.53, to $11.39 per share, in order for the position to reach breakeven at expiration. Furthermore, the maximum loss on this leg of the position is limited to the initial investment of $1,950.
By entering the second leg of the debit spread, the trader has offset the cost of the overall position. In this case, the trader sold 50 March 12 calls for the bid price of $0.14, netting a total credit of $700 [(0.14 x 100) x 50]. Combining this leg of the trade with the purchased March 11 calls lowers the total cost of the entire position to $1,250 ($1,950 - $700).
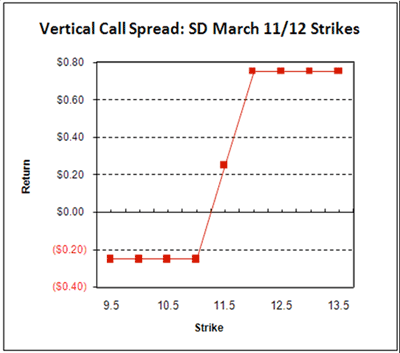
The maximum profit is calculated by subtracting the net premium paid from the difference between the two strikes, and it is reached if SD rallies to $12 per share at expiration. In this case, the maximum profit is $0.75 [(12 - 11) - 0.25], or $75 per pair of contracts. The maximum loss is equal to the net debit of $0.25, or $25 per pair of contracts. Below is a chart for a rough visual representation of the trade's profit/loss scenario:
Implied Volatility
After the vertical call spread has been entered, increasing implied volatility (IV) is pretty much neutral to the overall position, as it lifts the value of both the sold option and the purchased option. At the time of the trade, IV for the March 11 call arrived at 50.09%, while the IV for the March 12 call came in at 53.06%. For comparison, SD's one-month historical volatility arrived at 57.13% as of the close last Friday (Feb. 25).
By Joseph Hargett, contributor, Schaeffer’s Trading Floor Blog


