As the VIX registers a five-year low, Jared Woodard of CondorOptions.com interprets what the market seems to be saying.
Options markets are confirming the recent strength in stocks, and to such an extent that we may be looking at a new, calmer volatility environment for quite some time. That’s the conclusion of a note published this week by Goldman Sachs analysts Krag Gregory and Jose Gonzalo Rangel, who argue that S&P 500 implied volatility is shifting into a new distinct regime. They look at the history of prior CBOE Volatility Index (VIX) regimes and make the case that odds of a new environment started rising last July, when the ECB promised to do “whatever it takes” to support the Eurozone.
I’m inclined to downplay the value of multi-year volatility bucketing, since at that time horizon it seems to be mostly a function of economic cycles and the distribution of equity returns, but that’s not actually what I want to write about.
The prospect of a genuine economic recovery and of a secular decline in volatility seems unthinkable to the doomsaying crowd, so it was no surprise when Tyler Durden at Zero Hedge made some claims on Wednesday to rebut the GS note.
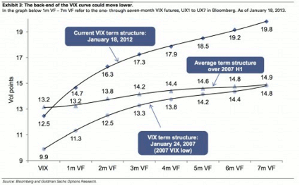
First, he pointed to elevated implied volatility in the back end of the VIX term structure, using the same chart that Goldman posts:

Fig. 1. Historical VIX term structure. Source: Goldman Sachs
Click
to Enlarge
There is no question that long-term implied volatility is higher than it has been in prior periods; but there are also intuitive reasons for that, many of which Goldman anticipates, and all of which Zero Hedge ignores. One argument is that since (or if) we are still in the beginning of a shift from moderate to low secular volatility, we have not yet seen a widespread move toward time-based spreads and carry trades that would push the back end of the term structure lower. If markets stay quiet, traders unwilling to incur high hedging costs will start to sell longer-term options to fund the purchase of short-term hedges. Another point is that the popularity of VIX-based ETNs like VXX and UVXY was not a factor in previous cycles, which makes historical comparisons difficult.
NEXT PAGE: Is the Market Complacent?
||pagebreak|
Second, Zero Hedge argues that short-term options implied volatility skew shows that the market is “extremely complacent,” but the chart he uses does not appear to adjust skew levels for the absolute level of at the money implied volatility. As I argued in previous research, unadjusted skew is just a duplicative, unhelpful proxy for overall IV. In fact, if you look at the historical time series of vol-adjusted 25 delta skew, what you’ll see is that skew is still at historically elevated levels. First, notice that before the financial crisis, this skew estimate traded around 0%, indicating that the difference between the IV of 25 delta puts and calls was a negligible percentage of at the money option premium.

Fig. 2. Historical 25 delta SPX implied volatility skew. Source: Condor Options, CBOE
Click
to Enlarge
An updated chart of the same estimate shows that, in the 20-30% range, option skew has only just fallen back to 2010 levels, and is still high compared to pre-crisis skew levels; “extremely complacent” is not even on the radar.

Fig. 3. 2-month 25 delta SPX implied volatility skew. Source: Condor Options, CBOE
Click
to Enlarge
Finally, he points to the spread between implied and realized volatility as another sign that markets have become too complacent. That’s an especially weak argument given the last several weeks of trading. Current estimates of historical volatility are higher than traders might expect right now because of the large moves in the market in the last two weeks of December and the first session of the new year. As those returns fall out of the backward-looking calculation window, historical volatility will decline to match the tone of recent trading. At 3.9%, ten-day SPX historical volatility (which does not include those wilder holiday sessions) is much more realistic market estimate than the 12-13% indicated by estimates with longer windows. And in that context, the one-month forward-looking VIX estimate near 13% looks quite rich, not inexpensively complacent.
Zero Hedge have been so wrong, for so long, that the site has become an object of ridicule for some. At least, in this case, there was an attempt to support boilerplate warnings about “risk flares” and “global monetary experimentation” with some hard analysis. It would help if the data matched the claims made about them.
By Jared Woodard of CondorOptions.com


