
Alan Ellman, of TheBlueCollarInvestor.com, highlights the option trading pluses and minuses of implied volatility versus historical volatility, and specifically, how implied volatility is calculated using standard deviation as it relates to a bell curve distribution of potential prices.
Understanding the concept of implied volatility is essential for successful covered call writing and selling puts. First, implied volatility gives us a window into the market’s perception of future price movement. It will also allow us to calculate probability of a stock price reaching a certain level. Like all other parameters, implied volatility, although quite important and useful, does have its limitations. Let’s first compare the two major types of volatility:
Historical Versus Implied Volatility
Historical volatility is the actual price fluctuation as observed over a specific time frame. More specifically, it is the annualized standard deviation (discussed below) of past stock price movements.
Implied volatility is a forecast or market opinion of the underlying security’s volatility as implied by the option’s prices in the current market.
For short-term option sellers like us, current information is much more important than historical data which may be more appropriate for longer-term investors.
Implied Volatility and Our Option Premiums
We know that the time value component of our option premiums is impacted by time to expiration and the implied volatility of the underlying security. Since most of us sell 1-month or 1-week options, time to expiration will remain constant when comparing premiums. That leaves the implied volatility as the main factor influencing premium (remember we are talking time value, not intrinsic value). The good news is that the greater the implied volatility, the more premium our option sales will generate. The bad news is that we are incurring more risk to the downside as calculated by using the implied volatility stat. Understanding implied volatility will allow us to make informed decisions as we compare premium to implied risk.
How Is Implied Volatility Calculated?
To calculate implied volatility, we need (or someone needs…) an option pricing model like the Black-Scholes Option Pricing Model. Of these six inputs below, implied volatility is the only one not directly observable in the market, and therefore, we need the other five inputs to calculate implied volatility.
- Call premium
- Exercise price
- Price of underlying
- Risk-free interest rate
- Time to expiration
- Implied volatility
Standard Deviation and Implied Volatility
The implied volatility generated from an option pricing model will tell us the probability of a certain price movement in either direction on an annualized basis. Let’s say a stock is trading at $30 and has an implied volatility of 20% for the at-the-money strike. This means that the share price, based on current option pricing, is expected to move up or down by $6 during the next year. In other words, the anticipated trading range is $24 to $36. This stat is for 1 standard deviation as it relates to a bell curve distribution of potential prices. Stated differently, we would expect a trading range of $24 to $36 68% of the time. Now, 2 standard deviations would be $12 in either direction or a range of $18 to $42 and is expected to stay in that range 95% of the time and 3 standard deviations would represent a range of $12 to $48 and would be expected to stay in that range 99% of the time. Still with me? Here’s what that distribution curve looks like:
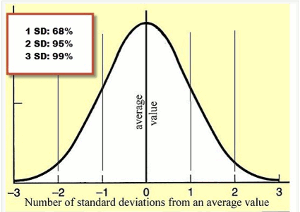
Standard deviation: normal bell curve
Click to Enlarge
Calculations for 1 Month and 1 Standard Deviation
Since very few of us trade 1-year options, these implied volatility stats must be customized to our shorter-term periods. It’s not necessary to remember this math, but you’re getting it anyway…
For a 30-day option and 1 standard deviation, we multiply the implied volatility stat by the square root of 30/365:
$30 x 20% x .286 = $1.72
This means that based on current option pricing, we would expect this stock to trade between $28.28 and $31.72 68% of the time during the next 30 days (I’m beginning to give myself a headache).
Summary
Implied volatility is more important to short-term option sellers than is historical volatility. It demonstrates market sentiment about future price movement, although does not define direction. We can use it to determine price probability, and therefore, risk parameters that will allow us to decide if a trade is consistent with our personal risk-tolerance and monthly goals. A quick, user-friendly way to estimate implied volatility is to look at the returns on an option. For example, if a 1-month at-the-money strike generates more than 6%, we are dealing with a high-implied volatility trade. This may be appropriate for some but not for others.
By Alan Ellman of TheBlueCollarInvestor.com


