
In the good old days before computer testing of market tools and rules was available, myth and magic in the markets were de rigueur. Fortunately, that has changed, writes Jake Bernstein Wednesday.
It is now possible to test virtually any objective idea or rule-based strategy by computer and therefore to know the truth.
It would seem that this would put to rest all opinions and disputes about the reality or profitability of specific market strategies and indicators.
However, it’s not that simple.
Why? Because the answers we get are a function of the questions we ask. As an example, consider the so-called Santa Claus rally.
What exactly is it? How do we define it? When does it begin? How long does it last? What is the track record of this rally? When does it end? How do we know the risk in taking advantage of the Santa Claus rally?
These are all extremely important questions with regard to performance, timing, and risk. Most pundits who espouse the high probability of the Santa Claus rally conveniently forget to mention or actually don’t know the answers to the questions I posed above. To get these answers we must resort to a little research. In this series of three articles I will show you that research prior to Christmas 2018.
A seasonal chart
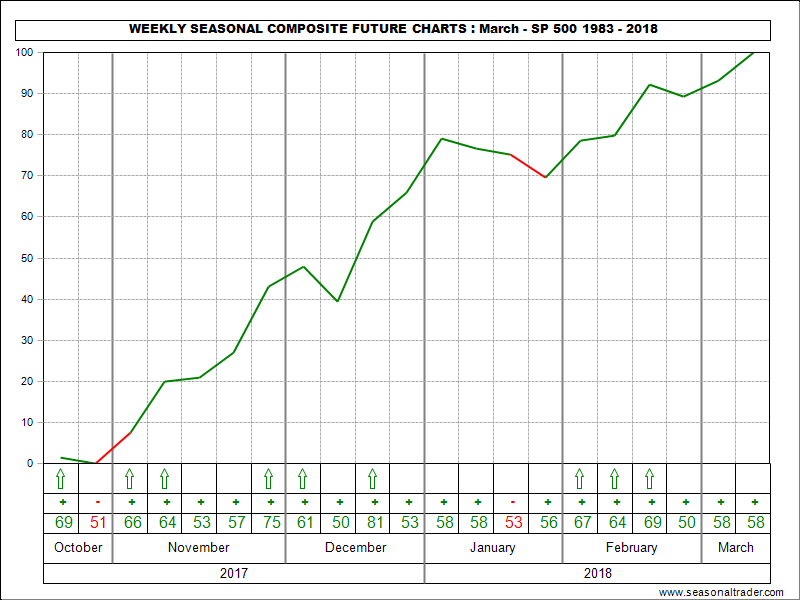
Let’s begin with a look at the composite weekly seasonal chart of S&P futures. The chart below shows the normalized seasonal pattern of stock index futures since inception of futures trading in this instrument.
Note the tendency of prices from late October through year-end. In particular note the timeframe around Christmas. Is this the Santa Claus rally? If so, can we take another step and zoom in on the exact timing of this pattern?
We will take the next step in part two of this series.
Come back soon for part 2.
Related: Find quality stocks in up trend, buy into the bad news, by Jake Bernstein.
Best of trading!
Jake Bernstein
www.jakebernstein.com


