
The QuantCycle Indicator reveals opportunities in crude oil, soybeans and the Dow Jones Index according to John Rawlins.
This week we present three short-term opportunities from the QuantCycle Indicator.
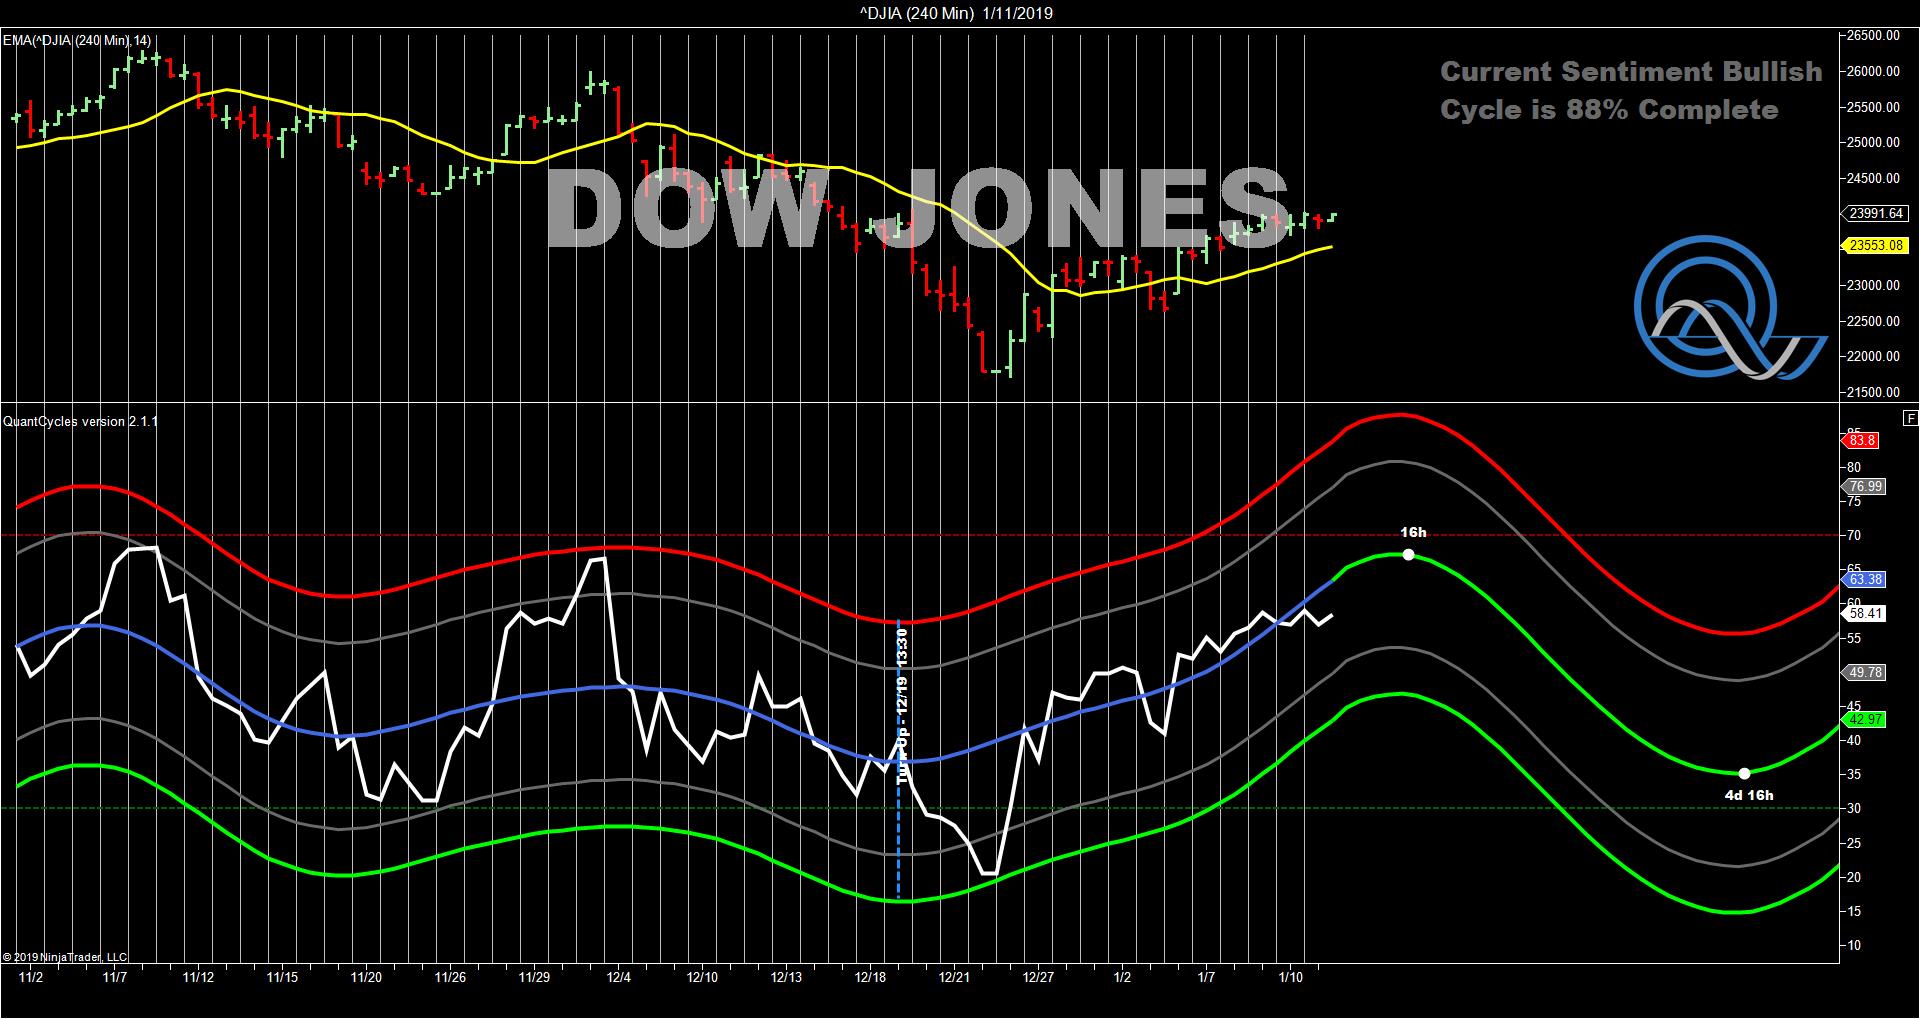
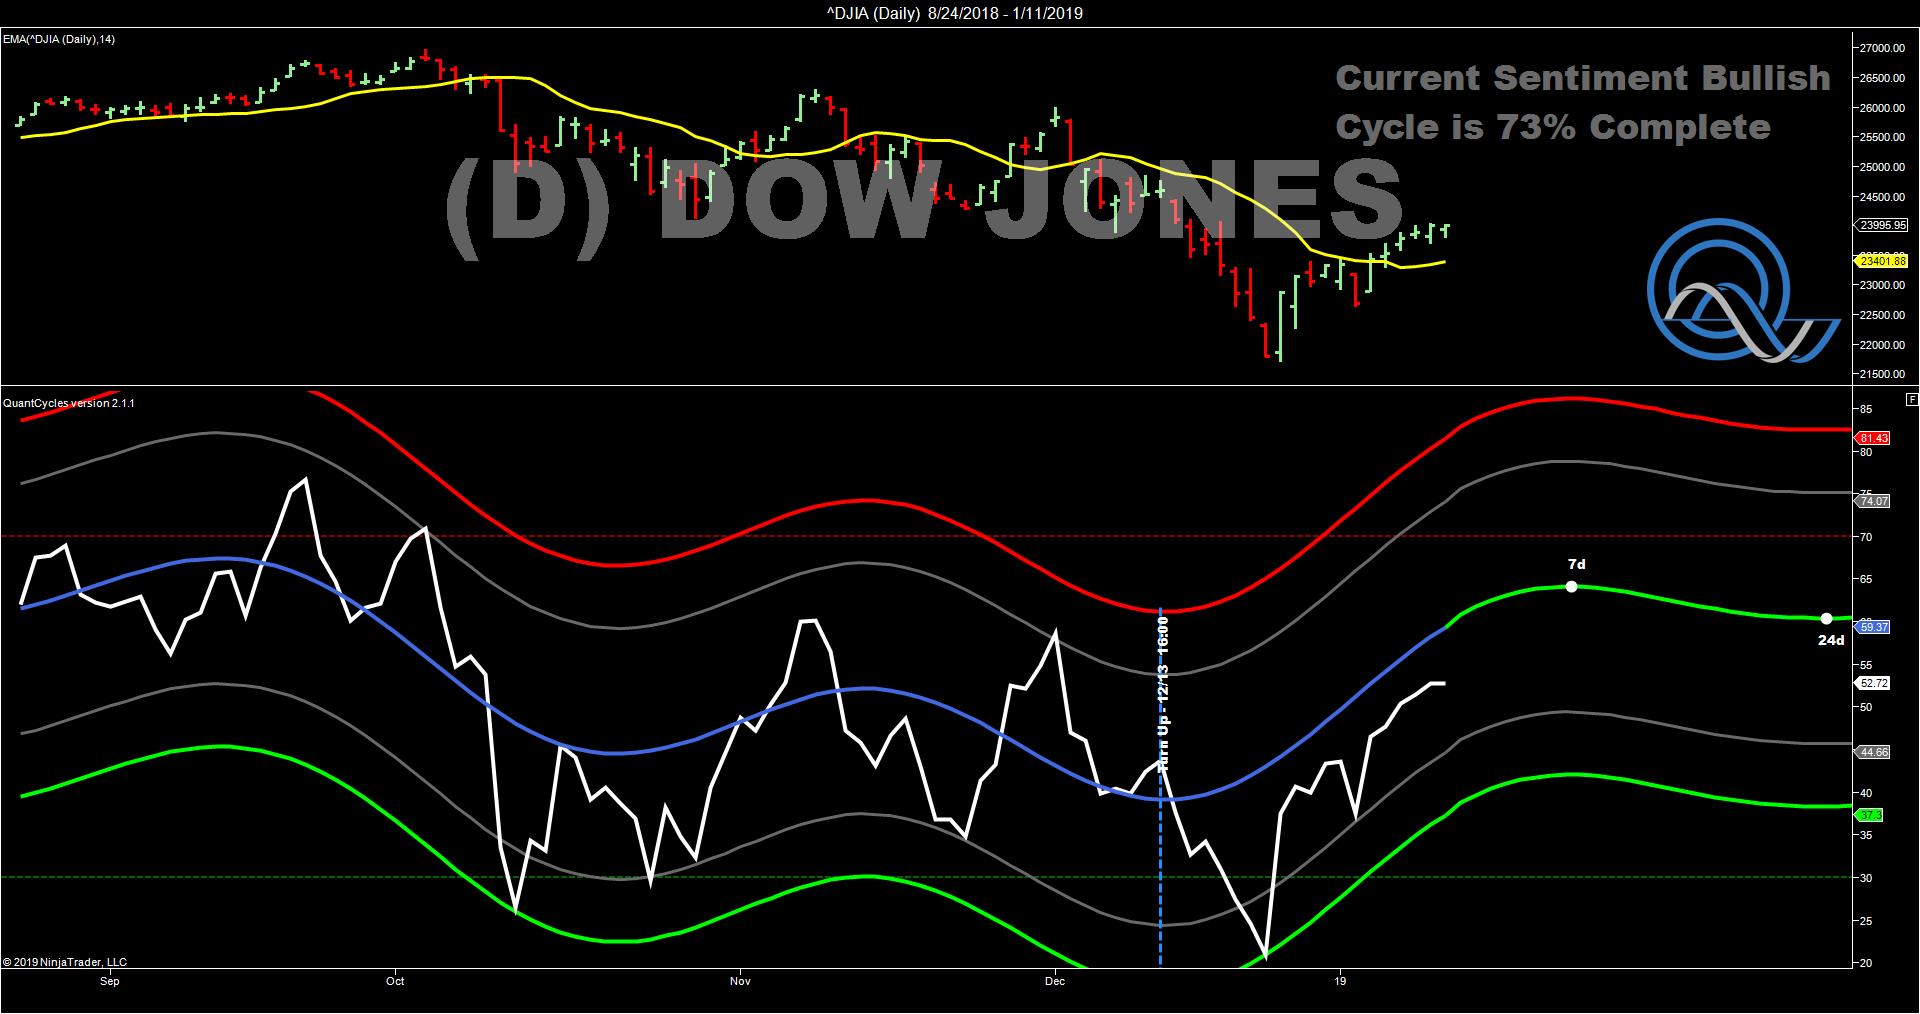
Dow Jones Index
The QuantCycle indicator presents an interesting scenario this week for the Dow Jones Index. On the 240-minite chart (see chart below), the Dow appears to have some strength left before it makes a significant short-term top. On the daily chart (second chart) that top may not hit for another weak. All things being equal, traders should look at any strong rally as a potential selling opportunity.
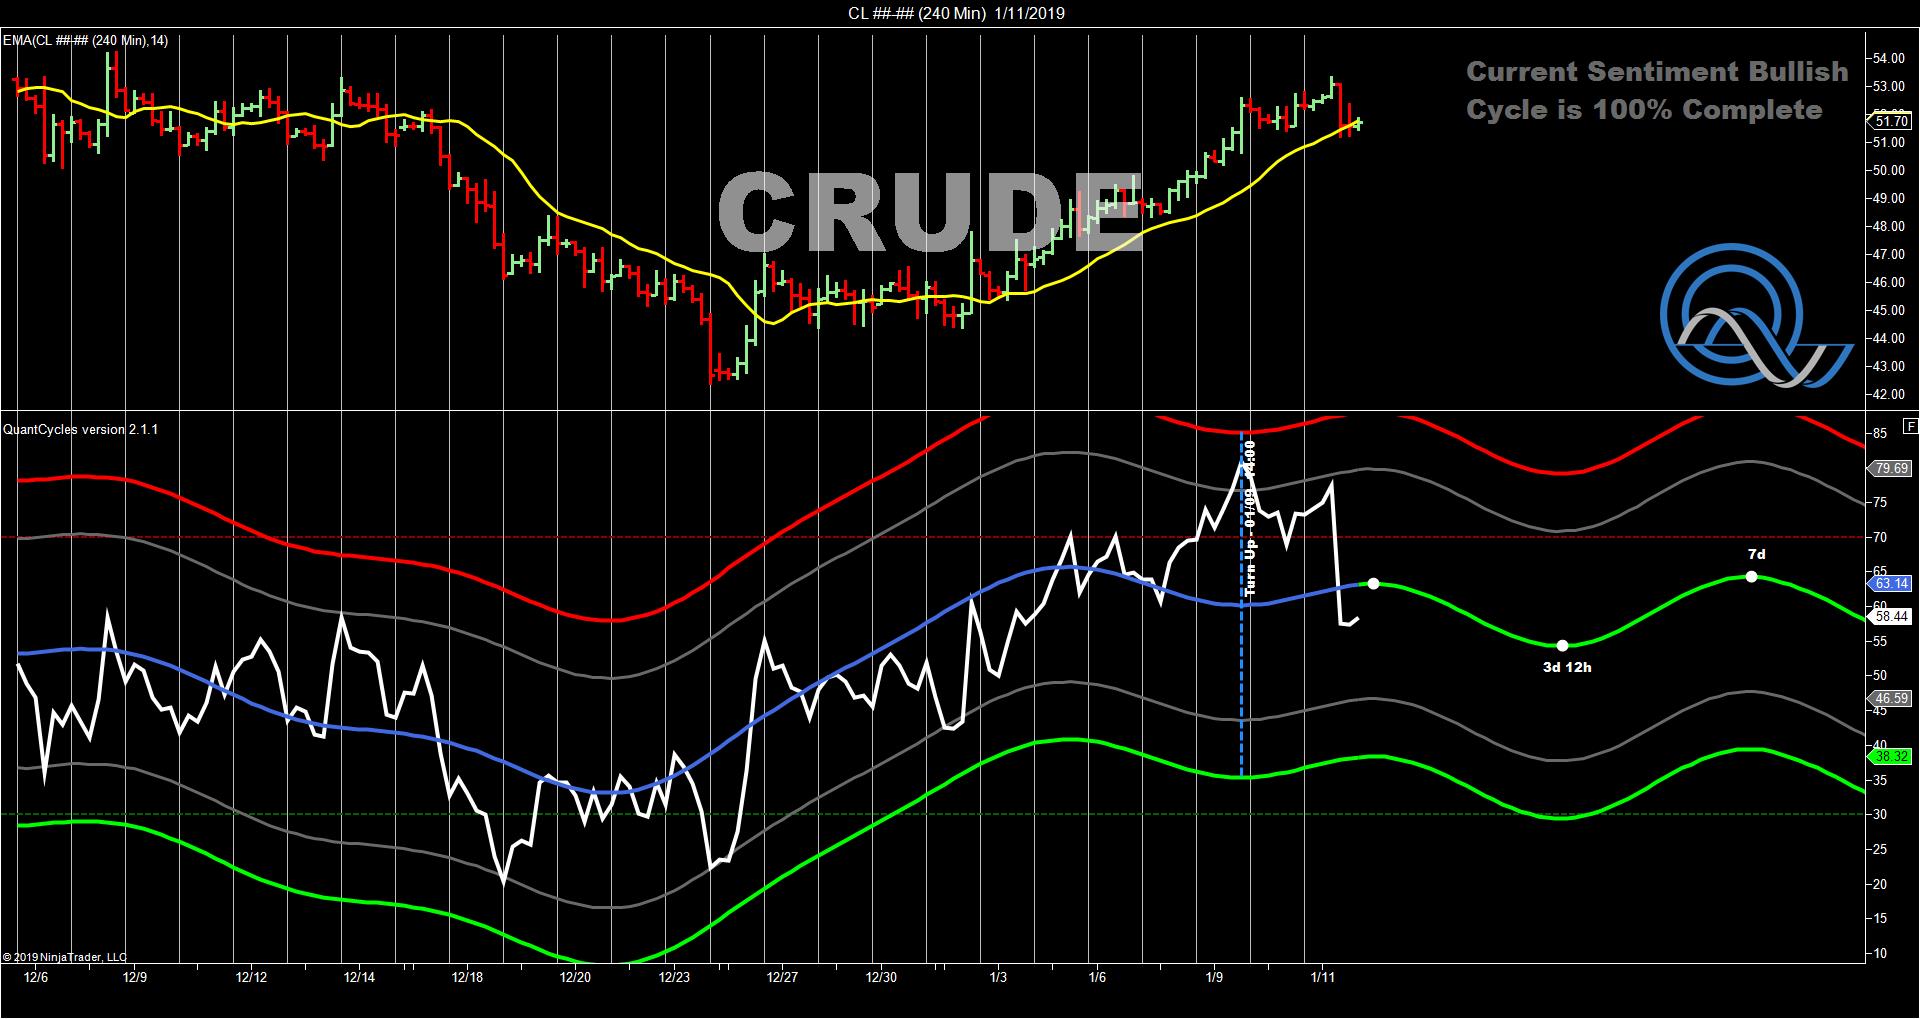
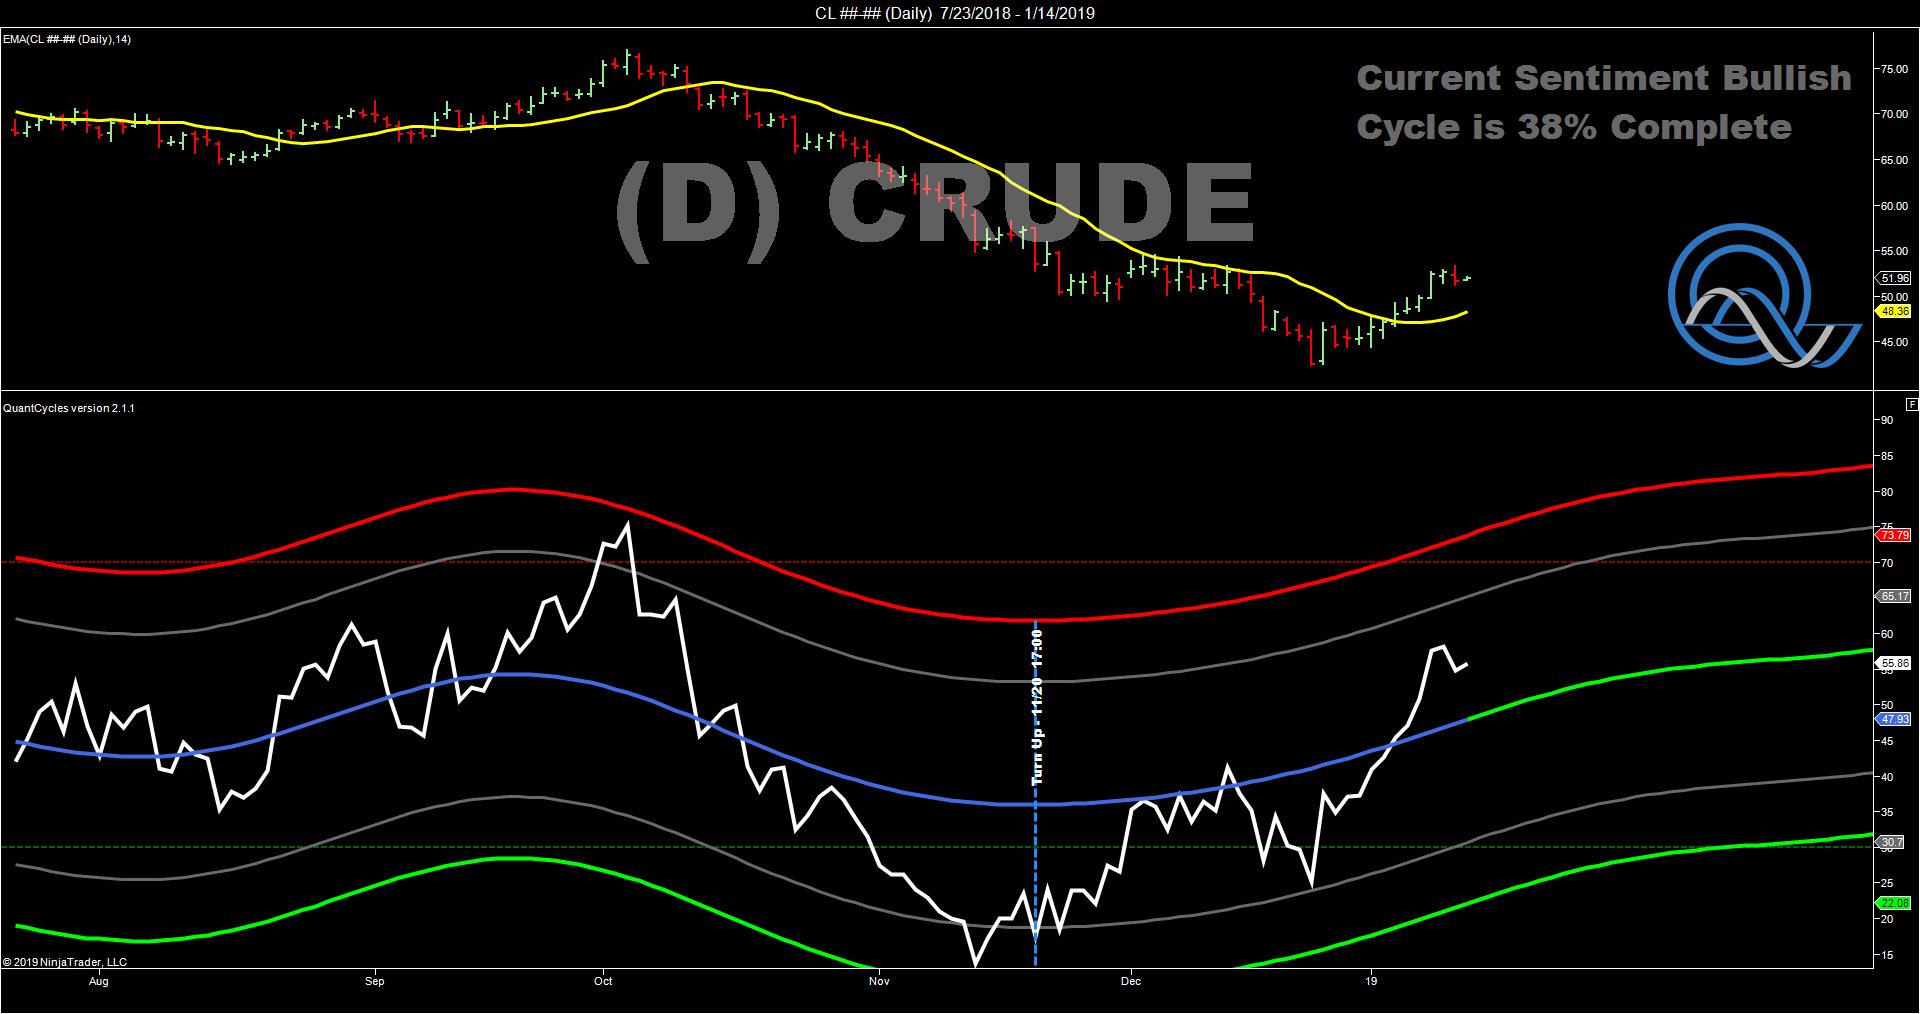
Crude Oil
Looking at the QuantCycle indicator for crude oil on a 240-minute chart (top chart) and daily (bottom chart) timeframe reveals a lot of about the recent volatility in the market. The shorter-term chart indicates extreme short-term volatility, while the daily chart shows a steadier, continued rise in crude. In this case, the best play is to view any short-term weakness as an opportunity to get long.
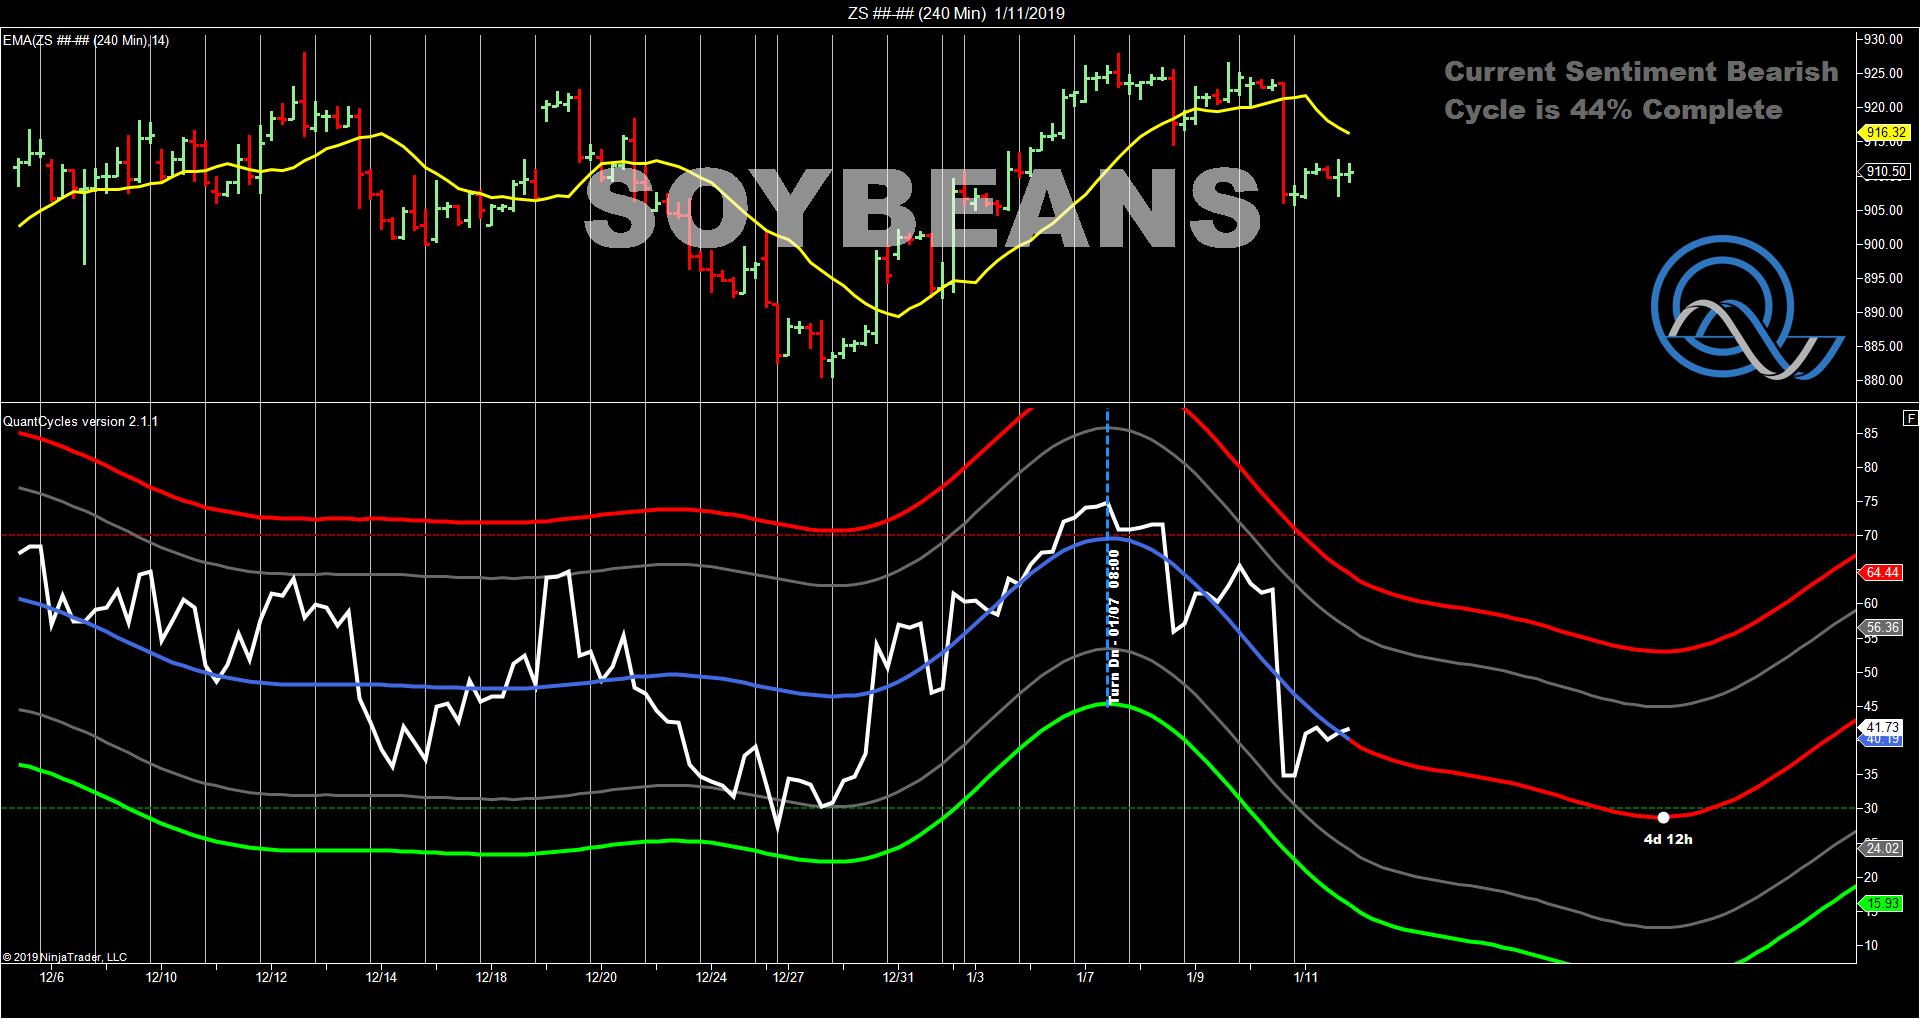
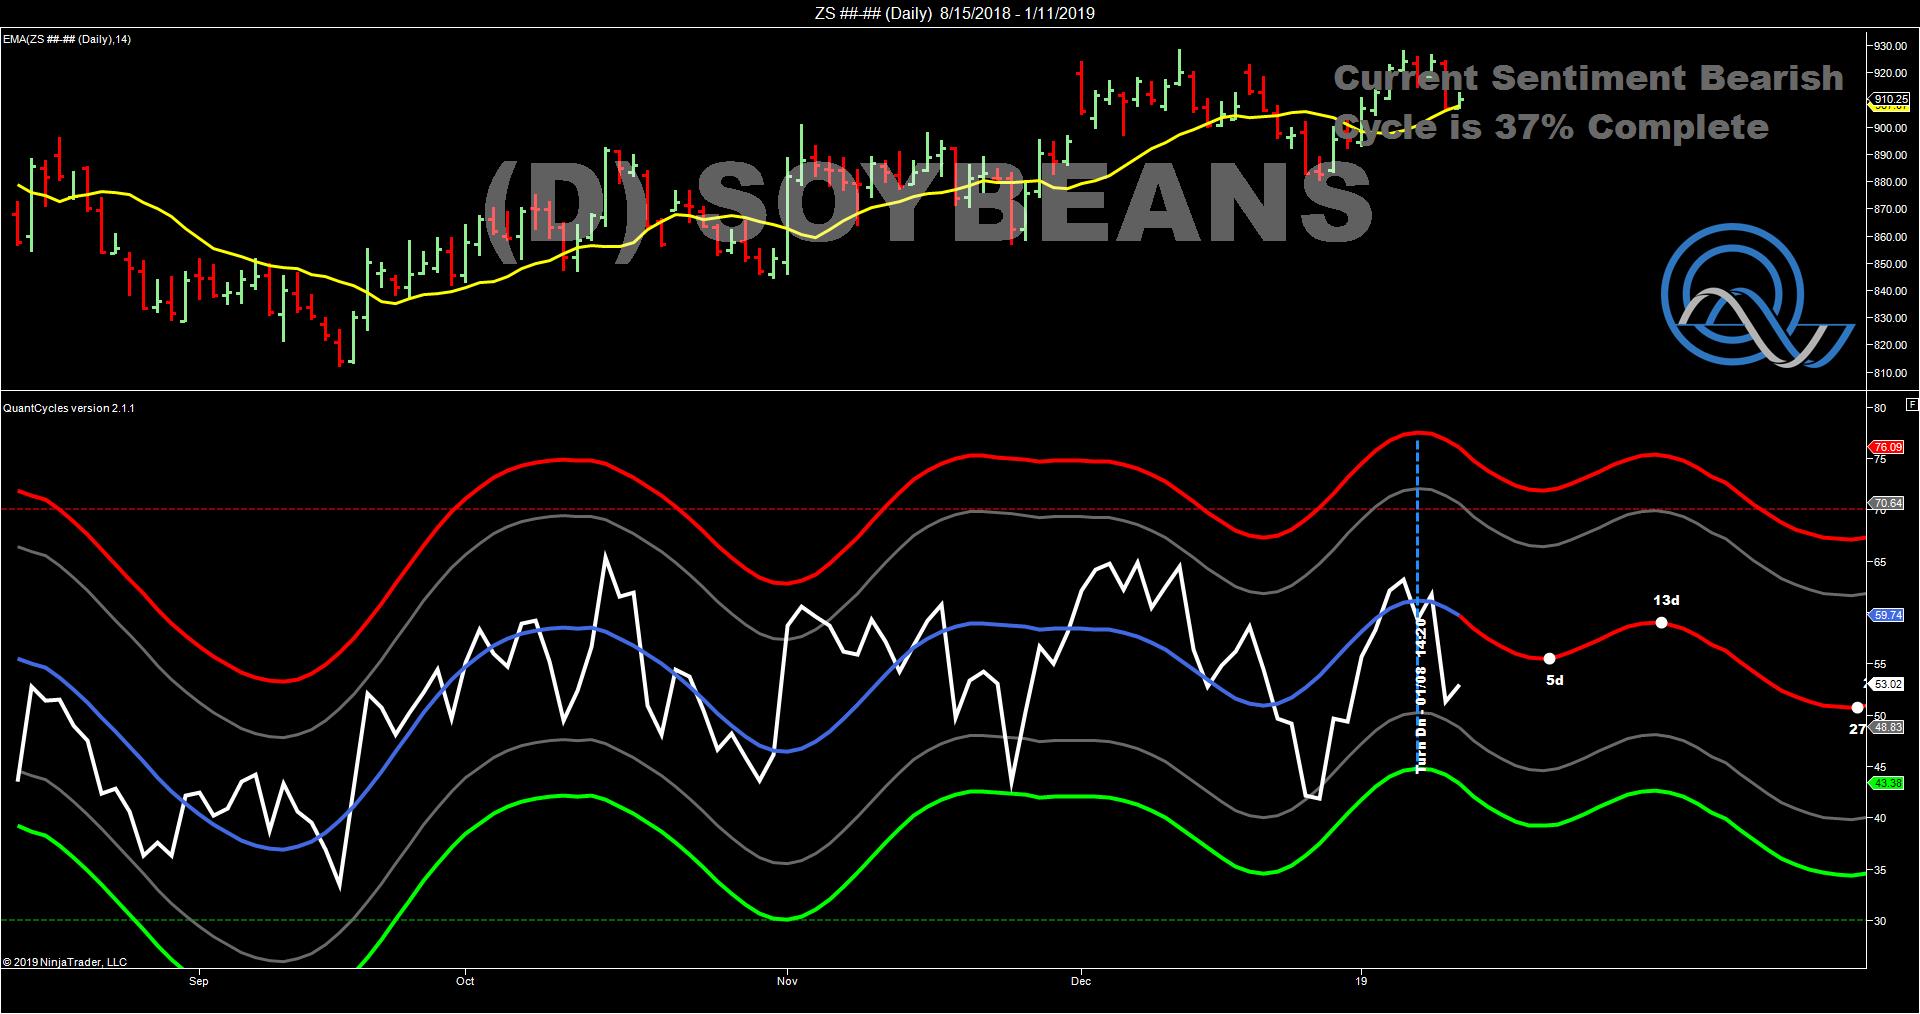
Soybeans
The QuantCycle expects last week’s weakness in soybeans to continue (see top chart). However, both the 240-minute chart and the daily chart (bottom chart) indicate that beans will make an interim low late in the week followed by a rebound. Traders should take profits on any short positions by the end of the week and not carry them into next weekend. While the QuantCycle shows a rebound beginning next week, it is not expected to take out the December high and it will be followed by a significant downturn, so any strength later in the month should be seen as a selling opportunity.
The QuantCycle indicator is a technical tool that employs proprietary statistical techniques and complex algorithms to filter multiple cycles from historical data, combines them to obtain cyclical information from price data and then gives a graphical representation of their predictive behavior (center line forecast). Other proprietary frequency techniques are then employed to obtain the cycles embedded in the prices. The upper and lower bands of the oscillator represent a two-standard deviation move from the predictive price band and are indicative of extreme overbought/oversold conditions.


