
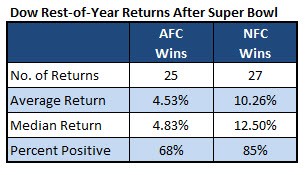
Super Bowl teams are set and based on the Super Bowl Indicator; investors should be rooting for the Los Angeles Rams, writes Rocky White.
The Super Bowl teams are set and based on the Super Bowl Indicator; investors should be rooting for the Los Angeles Rams. The table below shows the Dow Jones Industrial Average (DJI) has outperformed in years that the NFC team defeated the AFC team in the Super Bowl. I doubt, however, there’s anyone that takes the Super Bowl Indicator seriously. First of all, just because it showed some tendencies in the past doesn’t mean they’ll continue into the future. Second, it’s obviously a stupid indicator. I do think it provides a valuable lesson in randomness and being skeptical of more plausible sounding theories.
MORE RANDOMNESS IN STUDIES
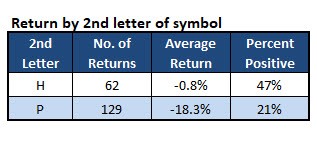
Here is another scurrilous example. I summarized 2018 stock returns based on the second letter in the ticker symbol. Why the second letter? Because some time ago I heard that during a bull market when a lot of investors want to buy, stocks with a letter early in the alphabet can outperform since investors often see lists of stocks in alphabetical order and buy the first good one that catches their eye. This way, it doesn’t even allow for that ridiculous theory.
Here’s what I found: In a year in which the S&P 500 was down 6.2%, stocks with an H as the second letter in their symbol averaged a loss of less than 1% and nearly half the stocks were positive. Stocks with a P as the second letter, on the other hand, lost more than 18% with just 21% of them positive. That gap seems significant, but it’s obviously all due to randomness (see table).
THE LESSON BEHIND THE STUDIES
The examples exhibit how pernicious randomness can be in stock market studies. If the results above can come about purely by randomness, then so can the results of more plausible sounding theories. For example, the table below shows the S&P 500 Index (SPX) performs much better the rest of the year when January is positive rather than negative. This phenomenon is known as the January Barometer (not to be confused with the January Effect). The theory is that the early year stock returns create momentum for investors to buy or sell leading to the results you see below.
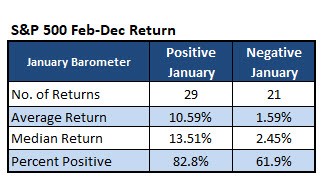
As someone who believes psychology plays a major role in market movements, this is a reasonable sounding theory. The fact remains though that it’s just a theory and it’s possible the results are solely due to randomness. I’m not saying studies like this are useless, of course. If I convinced everyone of that, no one would read my articles. I’m making a point to be wary of stock market studies because randomness plays a much bigger role than what many believe. This knowledge could save someone from putting too much faith (and therefore money) into a trade based on what looks like a rock-solid study.


