The moves forecasted by the COT signals make them very adaptable to commodity based ETFs, writes Andy Waldock.
One of my favorite things about trading is that it has allowed me to work in a global industry from the confines of little old Sandusky, Ohio. Good, bad or, otherwise, it has allowed me to steer my research and avoid the groupthink that commonly occurs in corporate offices and trading floors. Presenting at the Traders Expo New York was an excellent opportunity to boost the creative juices through conversing with some of the leading minds in our industry. I gave a master class on the Commitment of Traders (COT) report, and we’ll look at a setup that just triggered a buy signal in our weekly newsletter.
But first, we need to review last week’s calls. We expected, and got, reversals in several markets we had been following. Cotton, orange juice and the lean hog market all moved our way substantially. Hogs were up 12% or, $3,200 per futures contract for the week! The significant moves forecasted by the weekly COT signals make them very adaptable to commodity based ETFs. Orange juice jumped by 8.5% while cotton gained just under 3% for the week.
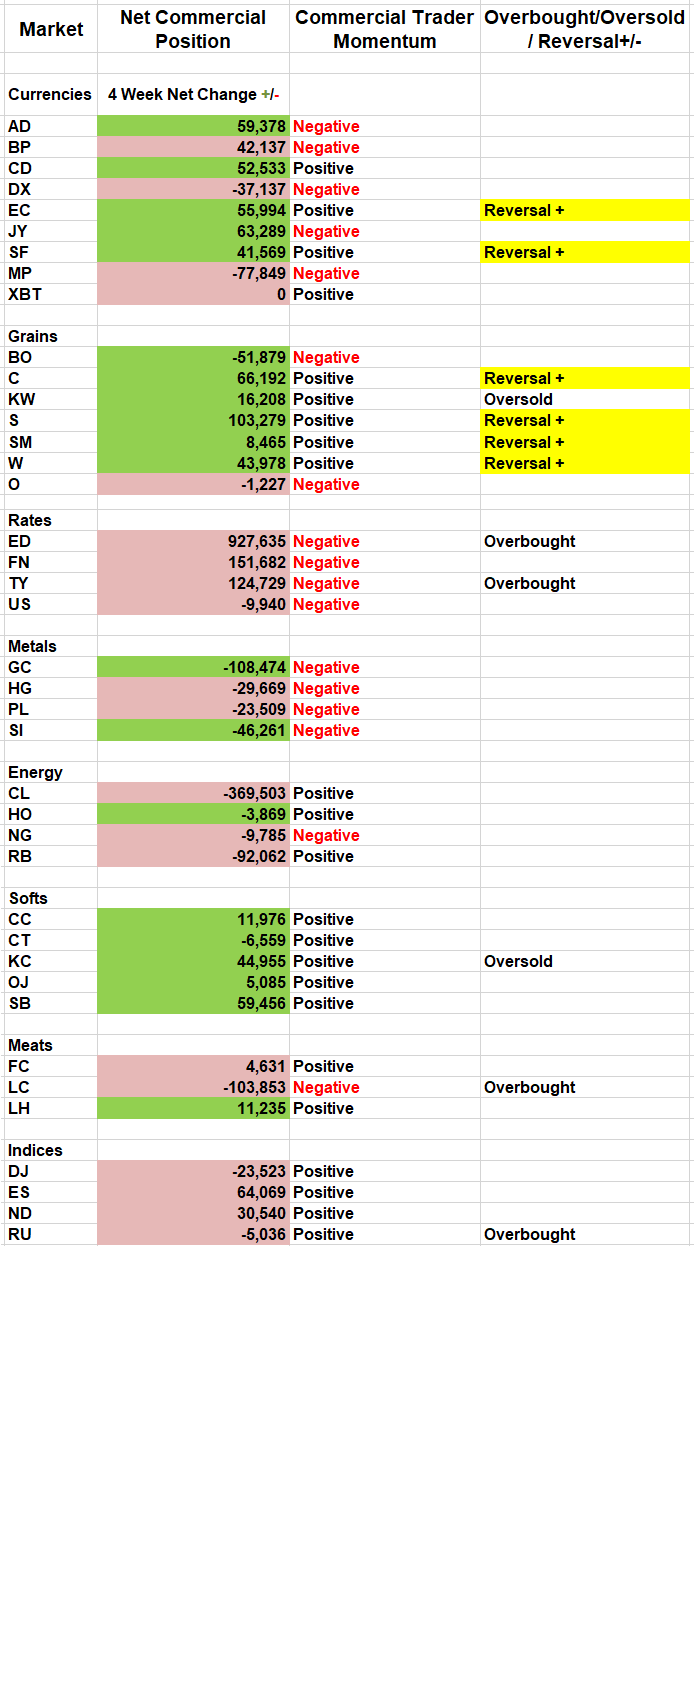
Watch the overbought/oversold column on the worksheet (below) to see which markets are on our watch list. We’ll post the trigger in the yellow box, along with “Reversal” and its forecasted direction. Our newsletters include more detail and the protective stop prices for making a practical risk assessment and trading plan.
Last week, every grain market except oats and soybean oil were on our watch list. These markets had positive commercial momentum and had become oversold due to speculative selling. We discussed this setup in detail at TradersEXPO New York as we described and plotted the behavior of the commercial traders versus the large speculators in the soybean market. Then, we analyzed the participants’ behavior against the backdrop of market volatility. The corresponding charts made it clear that commercial traders are buyers of processed commodities at low levels of volatility. Attendees were then shown what levels of volatility and how much commercial buying it takes to get the soybean market rolling. The current setup fits all of these criteria, and the weekly timeframe extends its suitability to ETF’s like the Teucrium Soybean Fund (SOYB) or, to harness the anticipated grain reversal as a whole, a broad-based commodity ETF like the Invesco DB Agriculture Fund (DBA), which has significantly more volume than the single commodity-based funds.
Finally, we’re beginning to see some topping action in the U.S. Dollar Index. The first move looks to be triggered by the euro. We sent a buy signal in the euro for last Tuesday’s trade and followed it with a sell signal in the Dollar Index the next day. Now, we’re getting confirmation on the weekly scale. The negative correlation between grains priced in dollars and the Dollar Index is an excellent example of the time and scale at which the commercial traders process and act upon newfound data as it relates to their business plans.