
One of the best ways to trade interest rates is with the three-month Eurodollar interest rate futures.
There are 40 quarterly Eurodollar interest rate future contracts extending over the maximum 10-year maturity and each contract with a maturity of three months is based on a hypothetical deposit of $1 million. Therefore, an interest rate change of one basis point (0.01%) is equal to $25, the tick size of a Eurodollar futures contract.
The market price of a Eurodollar futures contract is shown as 100 minus the annual interest rate for a given expiration month following the standard March, June, September and December cycle; however, other months are included for shorter maturities. These are July, August, October, and November. For example, on May 16, 2019 the price for the October 2016 contract was 97.6100, meaning that the Eurodollar rate for that maturity was 2.39%.
Quarterly Eurodollar rates can be used to compute a Eurodollar yield curve to accompany the curve of Eurodollar quarterly rates. The curves for Eurodollar rates and yields are shown on “Eurodollar Rates and Yields, May 21, 2019” and “Eurodollar Rates and Yields May 23, 2019.”
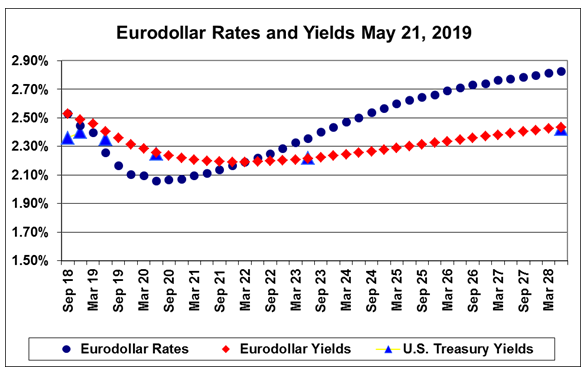
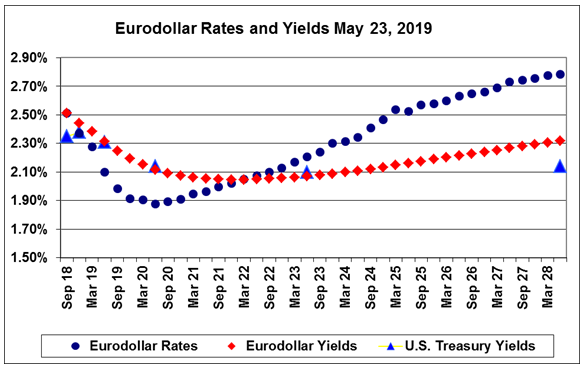
Notice that every one of the U.S. Treasury yields (three-month, six-month, one-year, two-years, five-years, and 10-years) falls on, or close to, the Eurodollar yield curve. Therefore, we can see that as the Treasury yield curve shifts – either from normal market forces or by Federal Reserve action – the quarterly rates on Eurodollar futures will change enough to keep the Eurodollar yield curve virtually equal to the Treasury yield at each maturity. The alternative explanation – that the U.S. Treasury yields try to be close to the Eurodollar yield curve – is interesting but probably not acceptable.
The Eurodollar futures yield curve is computed as a series of geometric means (exponentially discounted averages) of quarterly rates at each of the 40 quarterly contracts. Thus, each quarter’s yield is equal to the chain of products (1+ r) for all of the rates through the current quarter, with the (product of all of the (1 + r) values) ^ (1/current quarter number -1).
Because Eurodollar yields match the U.S. Treasury yields at each maturity, we can assume that the Treasury yield curve also depends on a stream of discounted shorter-term rates at each maturity. In other words, the Treasury yield curve is not a forecast of future yields but is instead geometric mean averages of shorter-term rates leading up to each maturity.
Trading the Current Interest Rate Market
At this time, profiting from falling Eurodollar rates will depend on a reduction in demand for short-term money or from a Federal Reserve decision to reduce short-term interest rates. Since the Eurodollar and Treasury rate and yield curves show an inversion with some short-term rates larger than long-term rates, a correction back to a normal relationship between maturities and interest rates could produce lower short-term rates. Economic forces such as the current trade wars will play a part in rate and yield changes. Right now, we will wait and see what happens.
On the two charts that are days apart, May 21 and May 23, several changes may be noted. The five-year Treasury yield dropped from 2.22% to 2.10%. The March 2020 Eurodollar futures rate fell from 2.10% to 1.91% —19 basis points for a profit of $475. On May 23 three of the five Treasury yields match the Eurodollar yield curve.
Not too many financial markets are as organized and predictable as Eurodollar futures. They are interesting to watch and can be a good source of trading profits.


