
While the Utilities Select Sector SPDR Fund (XLU) has performed well in 2019, it appears oversold and ready for a correction, writes John Rawlins.
When equity markets took a tumble at the end of 2018 many analysts thought that it was a sign the bull market was ending, or at least nearing the end. At that point many analysts cautioned that it was time for investors to concentrate on defensive sectors such as Treasuries, Real Estate Investment Trusts (REITs) and utilities.
Well the broad market recovered in 2019, but those defensive sectors did outperform the broader market.
When volatility jumped again in August, more voices pushed investors to those defensive sectors. And they produced, particularly Treasuries and the Utility Sector as measured by the Utilities Select Sector SPDR Fund (XLU). As you can see from the top portion of the weekly QuantCycles Oscillator, XLU took off at the beginning of 2019 and spiked even more sharply since August (see chart).
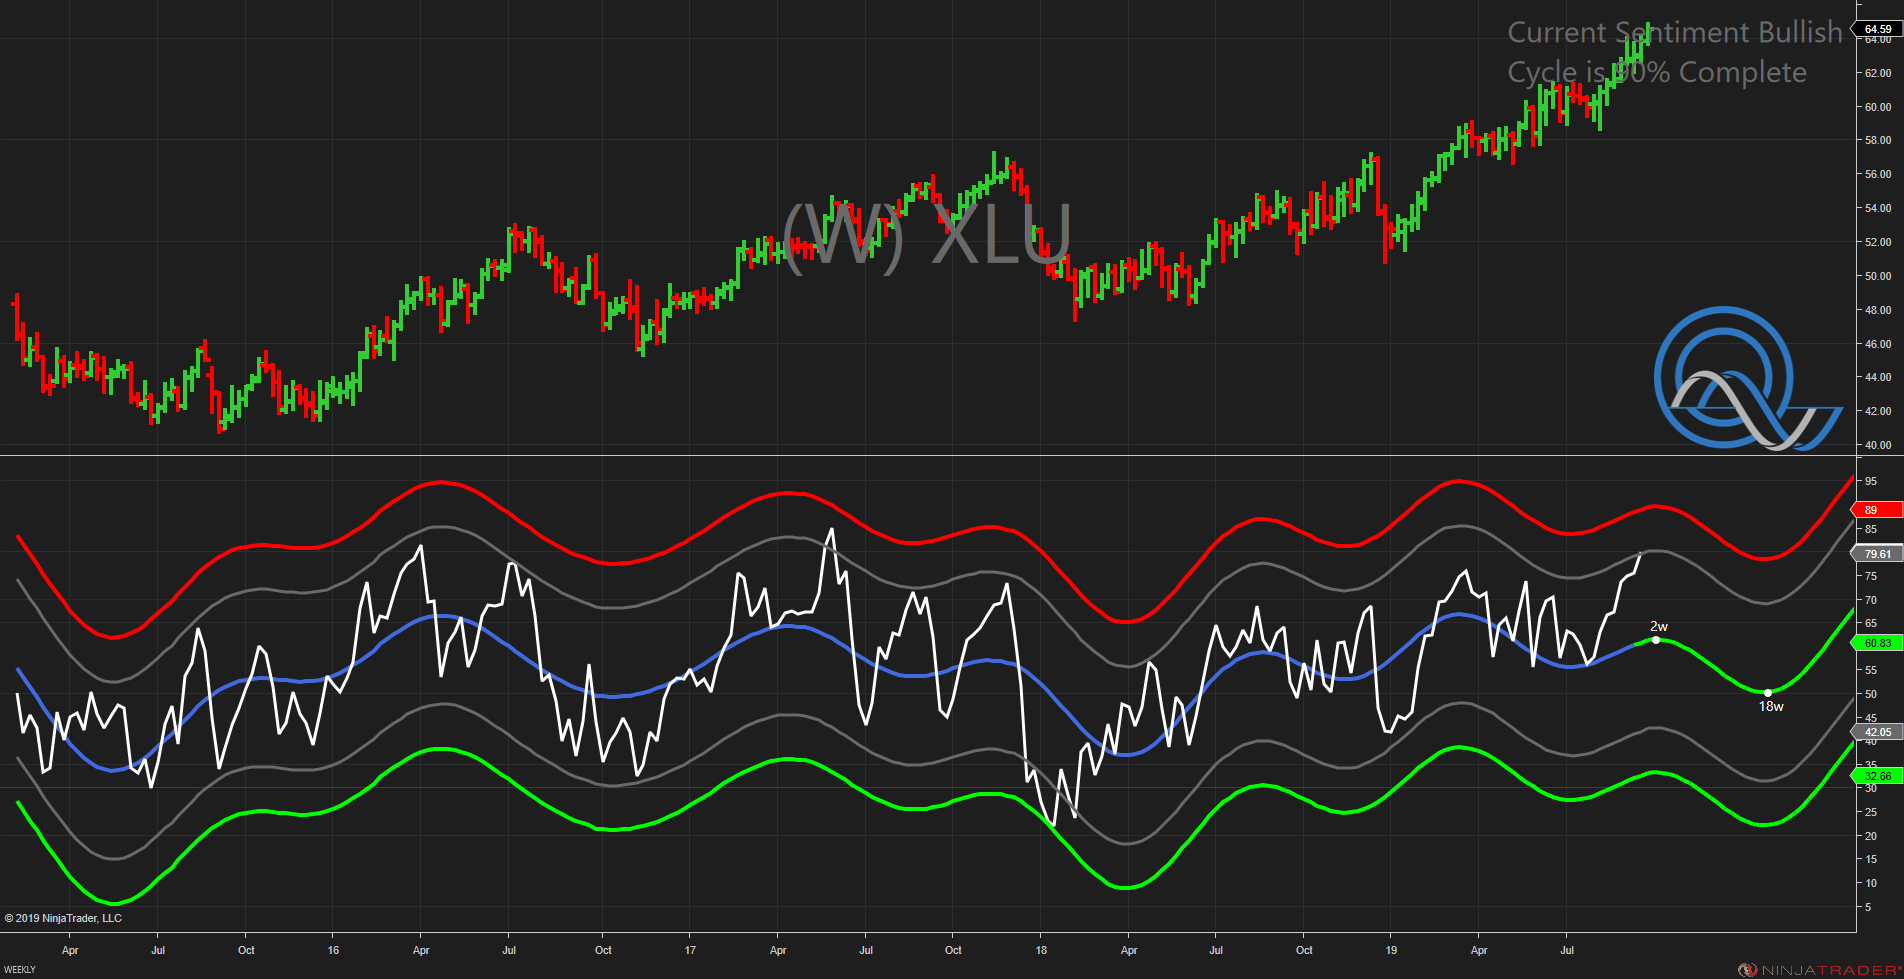
The recent strength in the XLU has pushed it near overbought territory just as the oscillator is indicating a top in the market.
The daily QuantCycles chart had XLU topping earlier this month and the recent strength has pushed it into oversold territory (see chart).
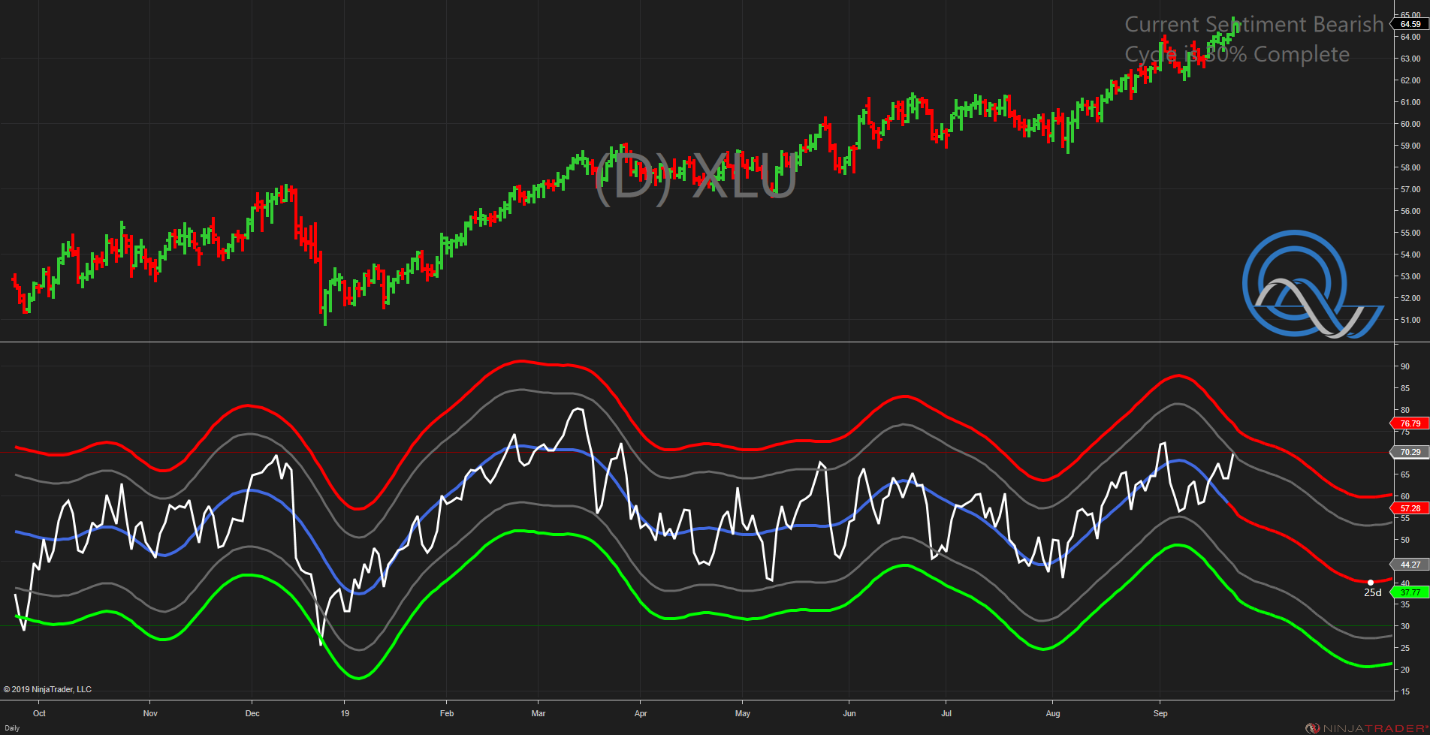
As you can see, both the daily and weekly QuantCycles project a serious downtrend for XLU, building a strong sell signal.
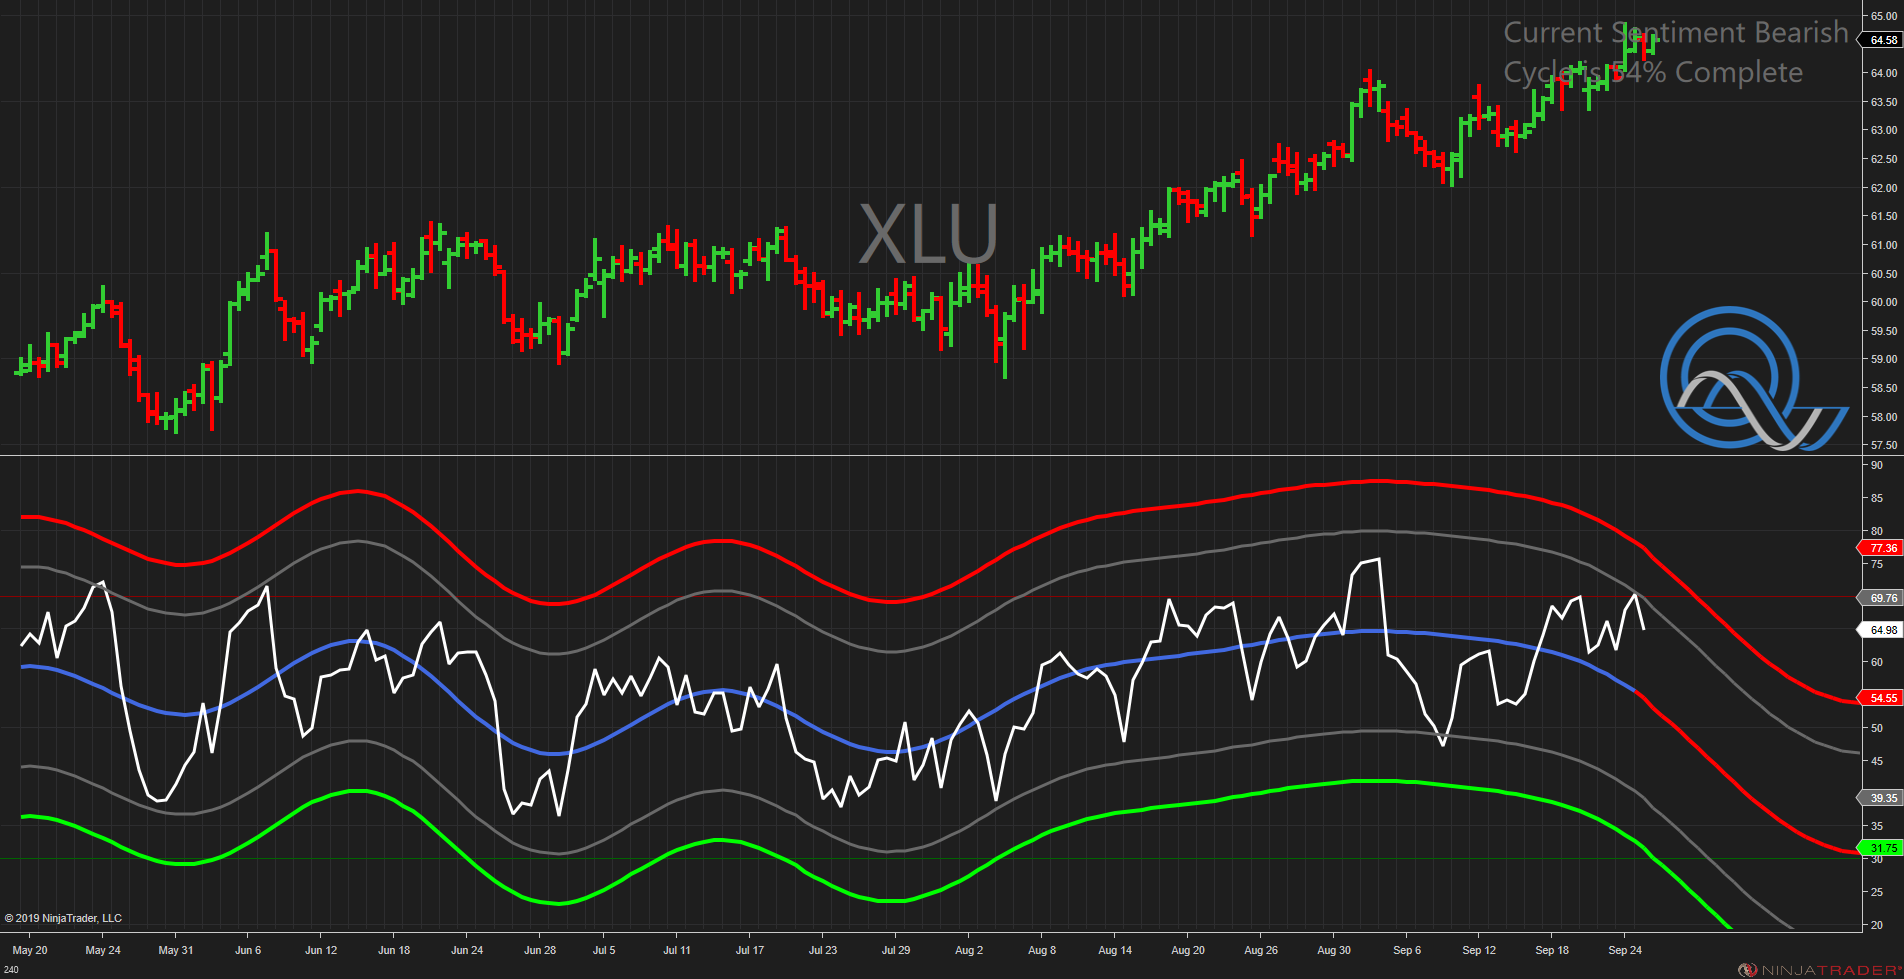
The short-term (240-minute) oscillator confirms this signal, creating a strong case for shorting XLU.
Utilities may have served its function and based on our analysis, traders may want to take profit or short the sector.
John Rawlins described the value of the QuantCycles Oscillator recently at The Orlando MoneyShow.
The QuantCycles indicator is a technical tool that employs proprietary statistical techniques and complex algorithms to filter multiple cycles from historical data, combines them to obtain cyclical information from price data and then gives a graphical representation of their predictive behavior (center line forecast). Other proprietary frequency techniques are then employed to obtain the cycles embedded in the prices. The upper and lower bands of the oscillator represent a two-standard deviation move from the predictive price band and are indicative of extreme overbought/oversold conditions.


