
Bitcoin will probably not be able to break below $6,000 or above $12,000 for at least six months, writes Al Brooks.
Bitcoin reversed up strongly two weeks ago but had a bear follow-through bar on the weekly chart (see below). There will probably be buyers below this week’s low. However, Bitcoin will likely be in a trading range for many months.
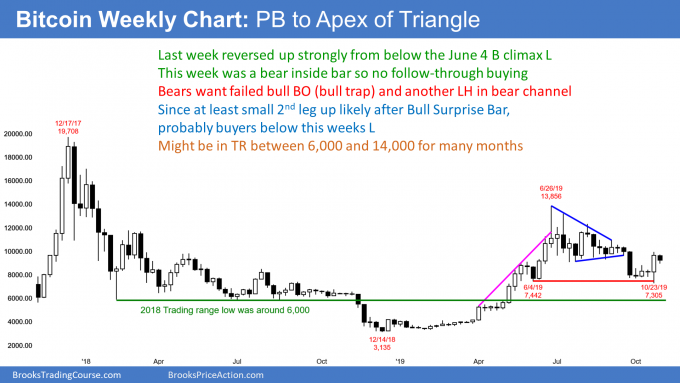
Bitcoin broke strongly below a three-month triangle in September on its weekly chart. In July and August, the bulls wanted to buy below the June buy climax low, not at $10,000. I stated that support at $10,000 would not hold and that there would be a test below 7,500. The September selloff was that test.
When there is a breakout below a triangle, there typically is a pullback to the apex of the triangle. At that point, traders decide if the bear trend will resume or if the pullback in fact is the start of a bull trend reversal.
Part of the decision involves an assessment of the strength of the rally back to the triangle. The rally two weeks ago on the daily chart was surprisingly strong. A bull Surprise Bar typically has at least a small second leg up. Consequently, the bulls will probably buy this week’s selloff. There will likely be buyers below this week’s low. Traders should expect at least a test of the top of the rally from two weeks ago.
If there is a strong break above that high, the October low will probably remain the low for the next few months. Also, the bulls would have a reasonable chance of the rally continuing up to any of the lower highs since the June top.
Bear case is not strong
The bears hope that this week will be a credible sell signal bar. They want the rally from two weeks ago to be a bull trap and just a test of the apex of the triangle. They know that there will probably soon be a test of the October high. If they can get a reversal down at that point, they will have a micro double top. That would give them a better chance of breaking below the October low and down to the $6,000 bottom of the 2018 trading range.
What is likely over the next few weeks?
Bitcoin will probably trade below this week’s low. It might go sideways to down for several weeks like it did after the Dec. 23, 2018 reversal up. However, there is enough confusion and uncertainty to limit the upside and downside for a couple months and maybe many months.
When traders do not expect a big rally or a big selloff, they take quick profits. The result is usually a trading range. The bottom of the range is now around the October low. However, it might expand down to $6,000, which was the bottom of the 2018 range. While $10,000 might be the top, the top more likely will be around the June through August highs at around $12,000.
Range more likely than bull trend
What is most likely to happen? A mess. That means a trading range, and it could be taller and last longer than what traders want. The lack of a second consecutive big bull trend bar this week created uncertainty. Compare to the follow-through bars of other strong rallies on the chart. This week’s hesitation reduces the chance that this rally will be like the others.
There is currently a 50% chance that the bottom of the range will be around $6,000. The bulls only have a 30% chance that this rally is the start of a bull trend up to $20,000. Any rally will probably have a hard time breaking above $12,000 where Bitcoin has reversed down repeatedly over the past two years. The 2017 blow-off top was also a failed breakout above $12,000.
The daily chart will probably test the high from two weeks ago. The test could happen this week. But there could be a deeper pullback that could last a few weeks first.
If there is a strong reversal down from a micro double top with the October high, traders will look for a deeper pullback, like down to the $6,000 bottom of the 2018 trading range. Alternatively, if the rally breaks strongly above the high, traders will expect a test of the September or August highs at around $12,000. In either case, Bitcoin will probably not be able to break below $6,000 or above $12,000 for at least six months.
It is too early to conclude that the low is in and that the bull trend is resuming. A trading range is always more common than a trend. The daily chart went sideways just above $10,000 for several months. If it gets back above $10,000, there is a good chance that it will go sideways again for at least several weeks. Traders should expect a trading range over the next six to 12 months. There could be a tighter range between $7,500 and $10,000.
Trading Room
Traders can see the end of the day bar-by-bar price action report by signing up for free at BrooksPriceAction.com. I talk about the detailed E-mini price action real-time throughout the day in the BrooksPriceAction.com trading room. We offer a two-day free trial.


