
The QuantCycles Oscillator is indicating weakness in the Nasdaq 100 in the near term, reports John Rawlins.
For weeks, months, even years, market technicians have tried to calculate the next major correction in stock indexes. The last one came just over a year ago in the fourth quarter of 2018. And it led to a huge move higher that has lasted to this day.
This despite an inverted yield curve (for a time), heightened geopolitical tensions, weak global economic growth and even the impeachment of a U.S. President.
While it is true, that investors playing the bear side have been crushed trying to predict the next correction, it is also true that all bullish trends come to an end—and usually experience a 10% correction every year or so.
Well the Quant Cycles Oscillator is showing its strongest bearish outlook in some time and it is doing it in the Nasdaq 100, which has been the stock index leader for most of its current move.
In the recent past these bearish outlooks have not panned out or the predicted sell-off has proven very minor and had been quickly reversed after a drop of a couple of percent. Will this time be different?
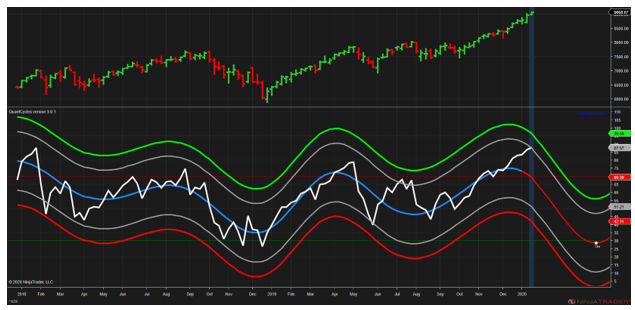
As you can see from the long-term (weekly) Quant Cycle Oscillator, the NDX has a topping pattern in December and has turned bearish. This has pushed the oscillator into overbought territory with an expectation that the market will sell-off sharply over the next three months.
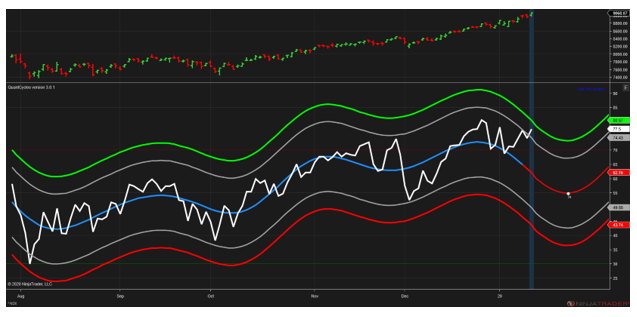
The daily oscillator is even more overbought, though it does foresee a rebound of sorts a week into the sell-off.
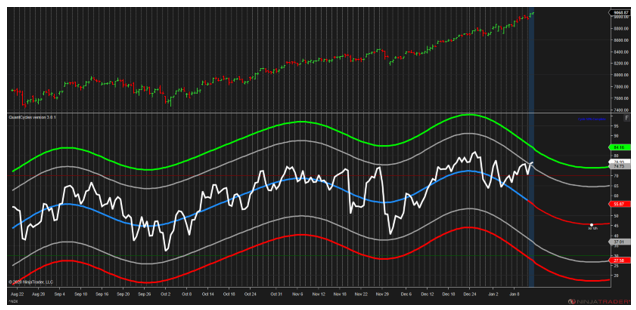
The four-hour chart confirms the longer-term analysis.
John Rawlins described the value of the QuantCycles Oscillator recently at The Orlando MoneyShow.
The QuantCycles indicator is a technical tool that employs proprietary statistical techniques and complex algorithms to filter multiple cycles from historical data, combines them to obtain cyclical information from price data and then gives a graphical representation of their predictive behavior (center line forecast). Other proprietary frequency techniques are then employed to obtain the cycles embedded in the prices. The upper and lower bands of the oscillator represent a two-standard deviation move from the predictive price band and are indicative of extreme overbought/oversold conditions.


