
The E-mini S&P 500 reversed down on Friday. This might be the start of a 5% correction, writes Al Brooks.
The E-mini S&P 500 reversal on down on Friday could be the start of a 5% correction, but there could be one more brief new high first.
The monthly E-mini S&P 500 chart is forming its fifth consecutive bull trend bar (see chart below). While this means that the bull trend is very strong, it is also becoming extreme. The tail on top of the January candlestick is a sign of a loss of momentum soon.
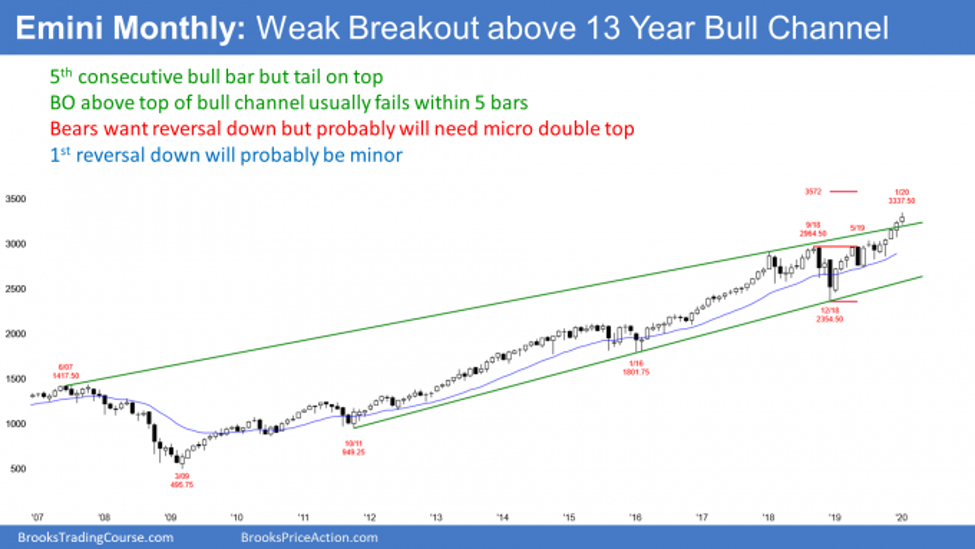
There are five trading days left in January. If Friday’s selling continues this week, January could have a bear body when it closes on Friday. If so, it would be a sell signal bar for February.
However, after four strong bull bars, the first reversal down will probably be minor. That means it would probably only last a bar or two. But on the monthly chart, that means two months, and it could be well over 100 points.
The bears typically need at least a micro double top to get more than a one- to two-bar pullback when a bull trend is strong. Traders expect the downside risk over the next several months to be small.
The E-mini futures formed a bear bar last week after two big bull bars closing near their highs on its weekly chart (below). I mentioned last week that a pause was likely this week. Those two bull bars formed the strongest breakout in the four-month bull trend. That typically attracts profit-taking, but there is often one more brief leg up before it begins. Traders are likely to begin to take some profits soon. They might have begun on Friday.
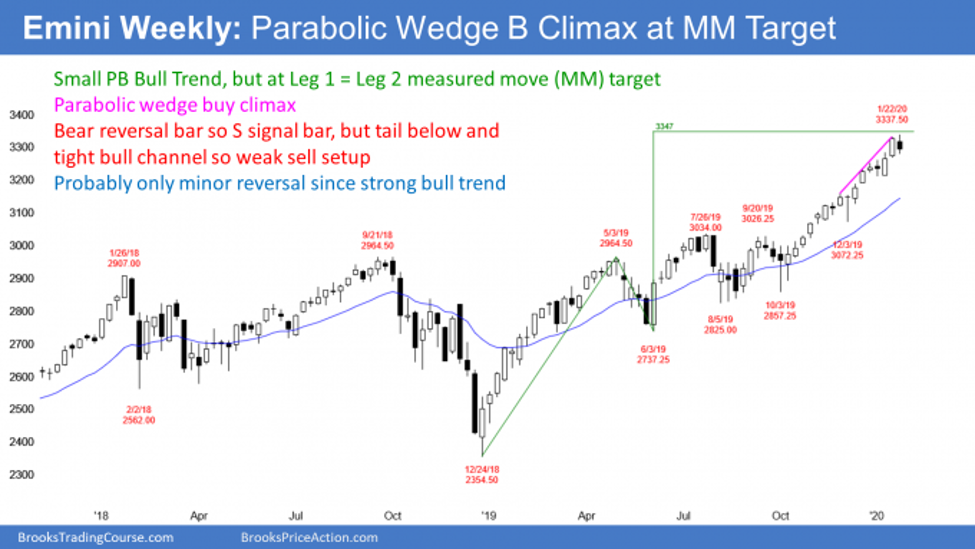
There is a parabolic wedge rally to a Leg 1 = Leg 2 measured move. Traders see this is a logical area for some profit-taking.
It is important to note that many computers see the second leg up as beginning with the Oct. 3 low instead of the June low. Their Leg 1 = Leg 2 target is near 3500 (not shown). The bulls have a good chance of reaching it later this year.
Last week’s bear body is a sell signal bar. Because of the prominent tail below and the tight bull channel, this is not a strong sell setup. Furthermore, there is still a 40% chance of one more brief new high before the 5% correction begins. But traders should expect at least a couple weeks of profit-taking soon.
Those two big bull bars late in a bull trend are similar to the pair of bars in early January 2018. At the time, I said that there would probably be a 5% correction beginning in a few weeks, but there might be one more brief push up first. As you can see, the bulls got that brief final push up and then the E-mini sold off 10% over the next month.
The chart pattern and the context (late in a buy climax) are the same this time. Traders should expect something similar.
Where is support?
The first target after a reversal down from a buy climax is the bottom of the most recent leg up. That is the low of the two-bull bars, which would be a test of around 3,200 and last year’s close. That is close enough to a 5% correction to make many bulls wait for the selloff to reach 5% before buying again.
The size of a pullback matters
Traders pay attention to the size of pullbacks. Certain numbers are support. For example, there were several pullbacks over the past two years that were almost exactly 10% or 20%. That tells you that traders were looking to buy a 10% or 20% pullback.
Other common pullbacks are 2% and 5%. Since this bull trend has lasted so long, the pullback will probably last at least a couple weeks and test the low from three weeks ago. Therefore, 5% might be the number where the bulls will look to buy again.
Buy climax and now a possible top
Bull trends and buy climaxes can last a long time, but not forever. This buy climax has lasted four months, which is unusually long. It increases the chance of profit-taking and a pullback soon, and it might now be underway.
It is important to understand that there is no reversal down yet on the weekly chart. The bears currently only have a weak sell signal bar.
Also, markets have inertia. That means they resist change. When there is a strong bull trend, most attempts to reverse will form a bull flag or a trading range, not bear trend.
Additionally, even if the bears get a 5% pullback, traders will buy it. Strong bull trends usually do not instantly reverse into bear trends. There typically will be a transition into a trading range first. Consequently, the downside risk over the next couple months is not great.
The E-mini S&P futures has been in a Small Pullback Bull trend for four months on the daily chart (below). Traders have bought every one- to three-day pullback for four months.
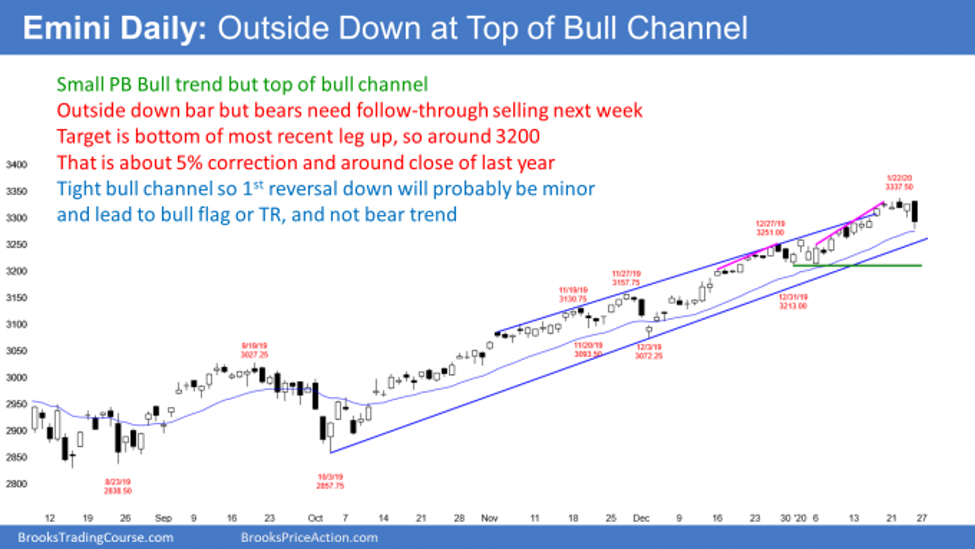
The bears now have a big outside down bar on Friday. But it has a prominent tail below and so far, the pullback has lasted only two days. There is still a 40% chance that the bulls will buy it next week. If so, their buying could lead to another high before there is a 5% pullback.
Monday and Tuesday are important. If either is a big bear day, the odds will favor a 5% pullback within a couple weeks. On the other hand, if either is a bull bar closing near its high, traders will begin to think that Friday was a bear trap. Many traders would buy above the bull bar and bet that the Small Pullback Bull Trend is still intact.
3,300 is resistance
In early January, the bulls tried for several days to break above 3,300. I discussed this at the time in the chat room. I said that it meant that traders saw 3,300 as an important price.
The E-mini gapped above it on Jan. 16, but there was no follow-through buying. Traders were wondering if the breakout would hold. The bulls tried to reverse up from it on Thursday, but the bears broke strongly below it on Friday. It is now short-term resistance.
Why 3,300? I don’t care. All that matters is that traders see it as an important price. It therefore might be important for the next several months.
What does that mean? Well, if the E-mini sells off strongly from here, traders will expect it to get back to 3,300 within a few months. Alternatively, if the bulls rally far above it over the next few weeks, there will probably be a pullback down to it within a couple months. It looks like traders care about it.
E-mini reversing down from top of bull channel
Since the E-mini was at the top of the bull channel on the daily chart, traders expected a sideways to down move. Friday’s selloff already reached the minimum targets, which are the middle of the channel and the 20-day exponential moving average.
Because the channel is so tight, the bottom of the channel is not far below. The E-mini will probably reach it within a couple weeks by going sideways or down.
Normally, traders would expect buyers there. But because the chart is so climactic, there is an increased chance of a break below the bottom of the channel.
The next support is the bottom of the most recent leg up. That is the Jan 6 low, just above 3200. A test of that area would be about a 5% correction and a test of the 2019 close.
Trading Room
Traders can see the end of the day bar-by-bar price action report by signing up for free at BrooksPriceAction.com. I talk about the detailed E-mini price action real-time throughout the day in the BrooksPriceAction.com trading room. We offer a two-day free trial.


