
The wildly popular FANTAG stocks are all showing a potential profitable Cup and Handle breakouts, reports Suri Duddella.
In 2017, Jim Cramer of CNBC invented and popularized the acronym "FANG" for four high performing technology stocks in the markets: Facebook (FB), Amazon (AMZN), Netflix (NFLX) and Google (GOOG). FANG only represent four stocks, but there are many technology stocks that share similar spectacular growth stories in recent years; there is also Tesla (TSLA), Apple (AAPL), Adobe (ADBE), Broadcom Inc. (AVGO) and several more.
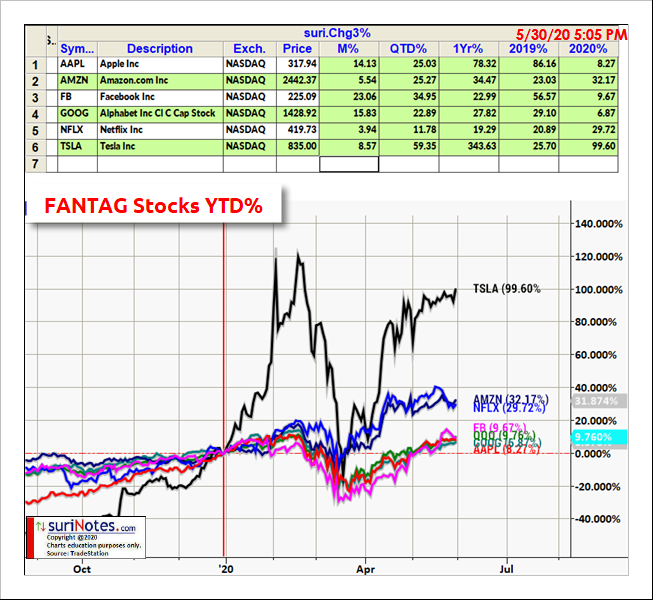
The six high-performing stocks is in another acronym: "FANTAG" for Facebook, Amazon, Netflix, Tesla, Apple, and Google. Here is a list of those stocks and their performances in 2019 and 2020. All these stocks are currently forming "Cup and Handle" patterns.
Cup & Handle Patterns
The Cup and Handle Chart pattern was developed and popularized by William J. O’Neil in the 1980s through his CANSLIM methodology, articles in Investor’s Business Daily and his book "How to Make Money in Stocks."
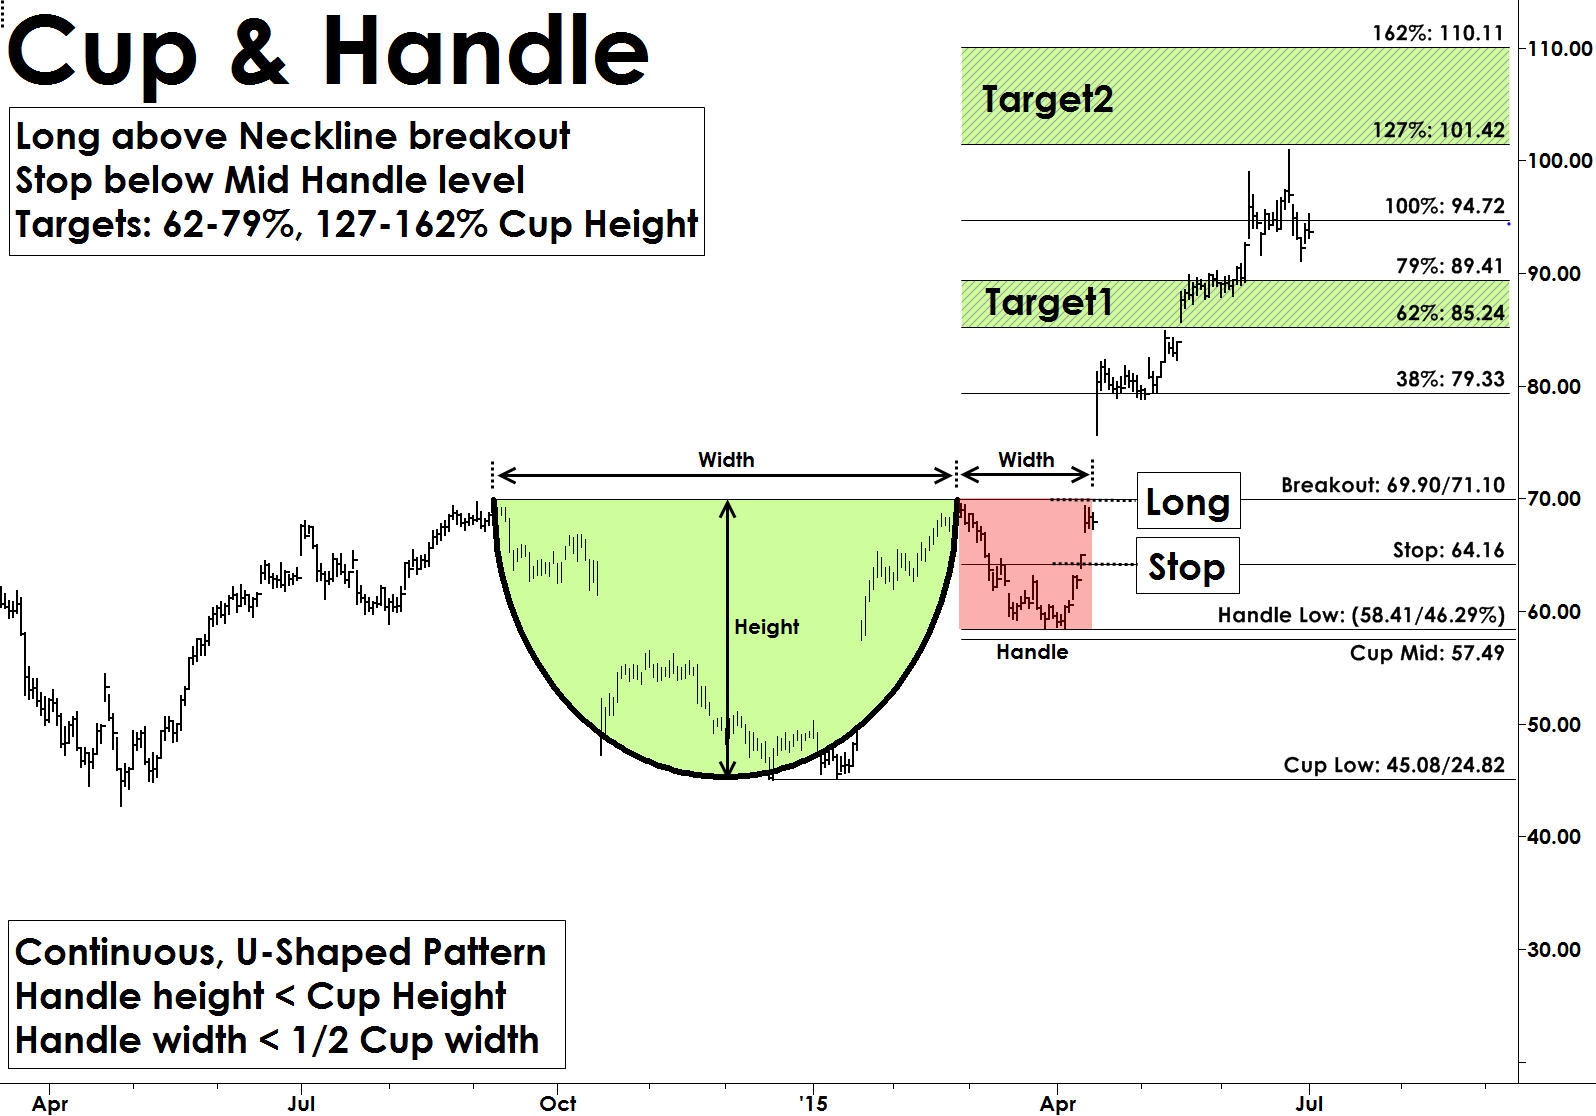
Cup and Handle pattern resembles a cup with a handle. It is a continuation patterns that usually forms in bullish trends. Most Cup and Handle patterns are very reliable and offer great trading opportunities. They also form in all markets and in all time-frames. The “Cup” formation is developed as consolidation phase during price rallies from the round bottom formation over multiple weeks to months. The “Handle” part forms due to a price correction after “Cup” formation and before a clear breakout to the upside.
Cup and Handle pattern structure show the momentum pause after reaching a new high in a U-Shape form, followed by another attempt to breakout. When this breakout from the rim of the cup fails it starts to fall back to build the "Handle" structure. Usually, the handle structures are small, and the handle depth should not exceed more than 50% of cup depth. This handle part of the pattern generates interest in buyers as they expect the pattern to breakout from these levels (see chart below). The pattern is valid only if price convincingly breaks out with increased volume above the rim of the cup levels.
FANTAG Stocks
Facebook is forming a Cup and Handle pattern on its daily chart and trading near its breakout level of $224.30. Cup and Handle patterns are valid only when price closes above the breakout level (see chart below). Facebook’s pattern mid-cup level is $180.65. Targets are: $257.30, $278 and $292.70. A stop is set below the handle's low.
AAPL is forming a Cup and Handle pattern on its daily chart and trading near breakout level of $327.95. The mid-cup Level on Apple’s pattern is $270.23. Targets are $371.64, $399.1 and $418.4. A stop is set below handle's low (see chart below).
NFLX is forming a Cup and Handle pattern on its daily chart and trading near the breakout level of $386.09. Its mid -cup level is $319.14. Targets are $436.80, $468.6 and $491.1. A stop is set below handle's low.
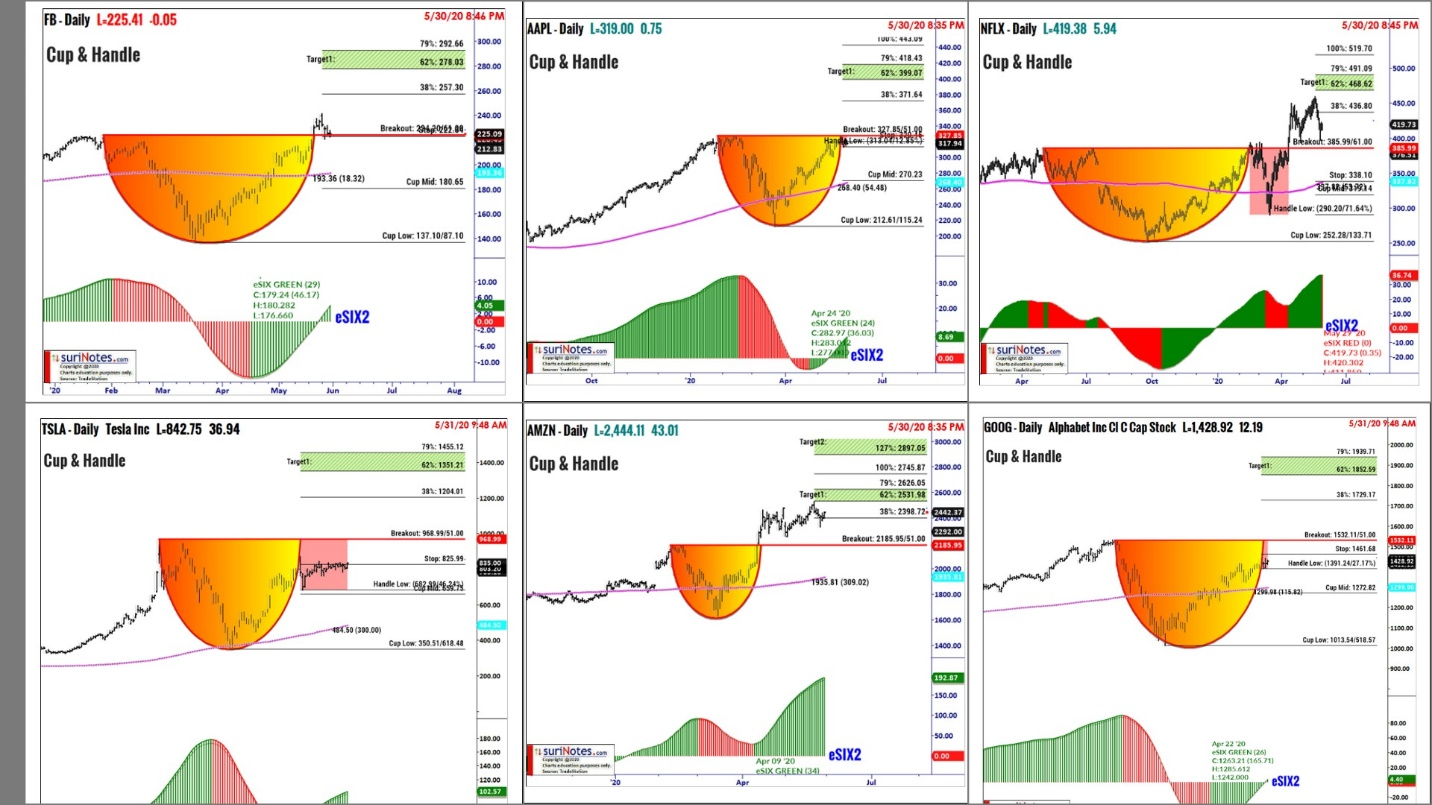
TSLA's breakout level on its Cup and Handle pattern is $969.09. Its mid-cup level is $659.75. Targets are $1,204.01, $1,351.20 and $1,455.10. A stop is set below handle's low.
AMZN's breakout level on its Cup and Handle pattern is $2,186.05. AMZN’s mid-cup level is $1,905.99. Targets are $2,398.72, $2,532 and $2,626. A stop is set below handle's low.
GOOG's breakout level is $1,532.21. Its mid-cup level is $1,272.82. Targets are $1,729.17, $1,852.60 and $1,939.70. A stop is set below handle's low.
Find more of Suri’s work at surinotes.com.


