
There is interesting set-up across the energy complex, reports John Rawlins.
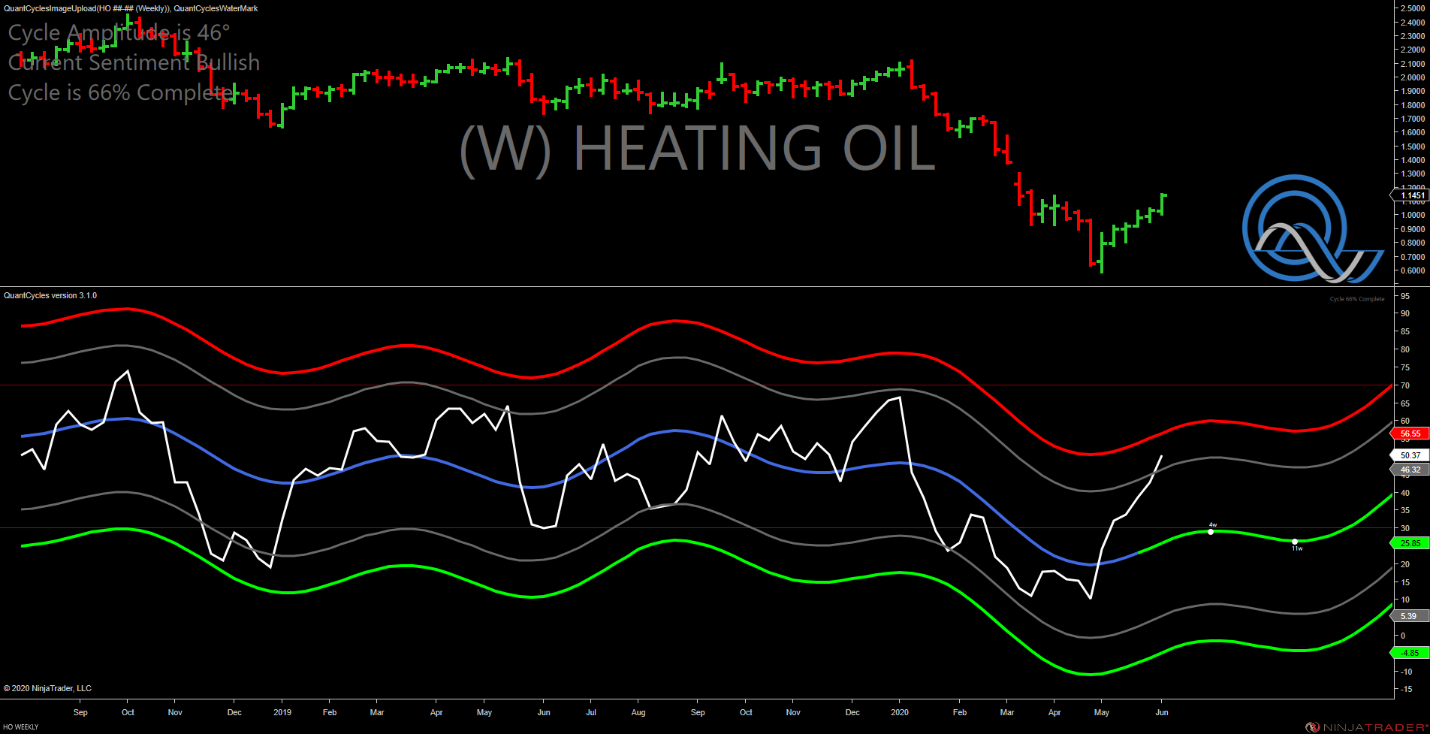
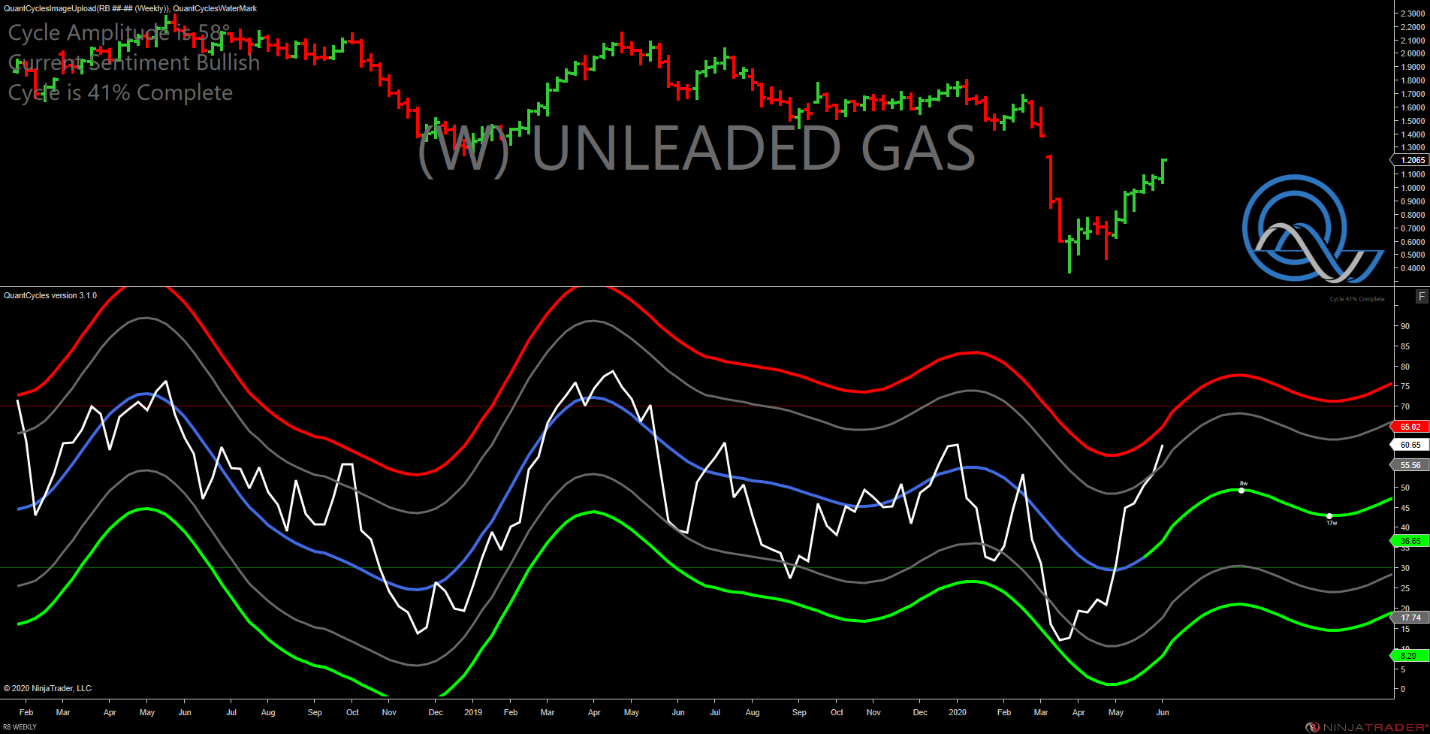
This is the first time in a while that we have reached daily extremes in crude oil, heating oil and unleaded gasoline (RBOB) at the same time.
All those markets are nearing or have surpassed major overbought conditions as the oscillators is turning lower. This is a major blinking light sell signal (see charts below).
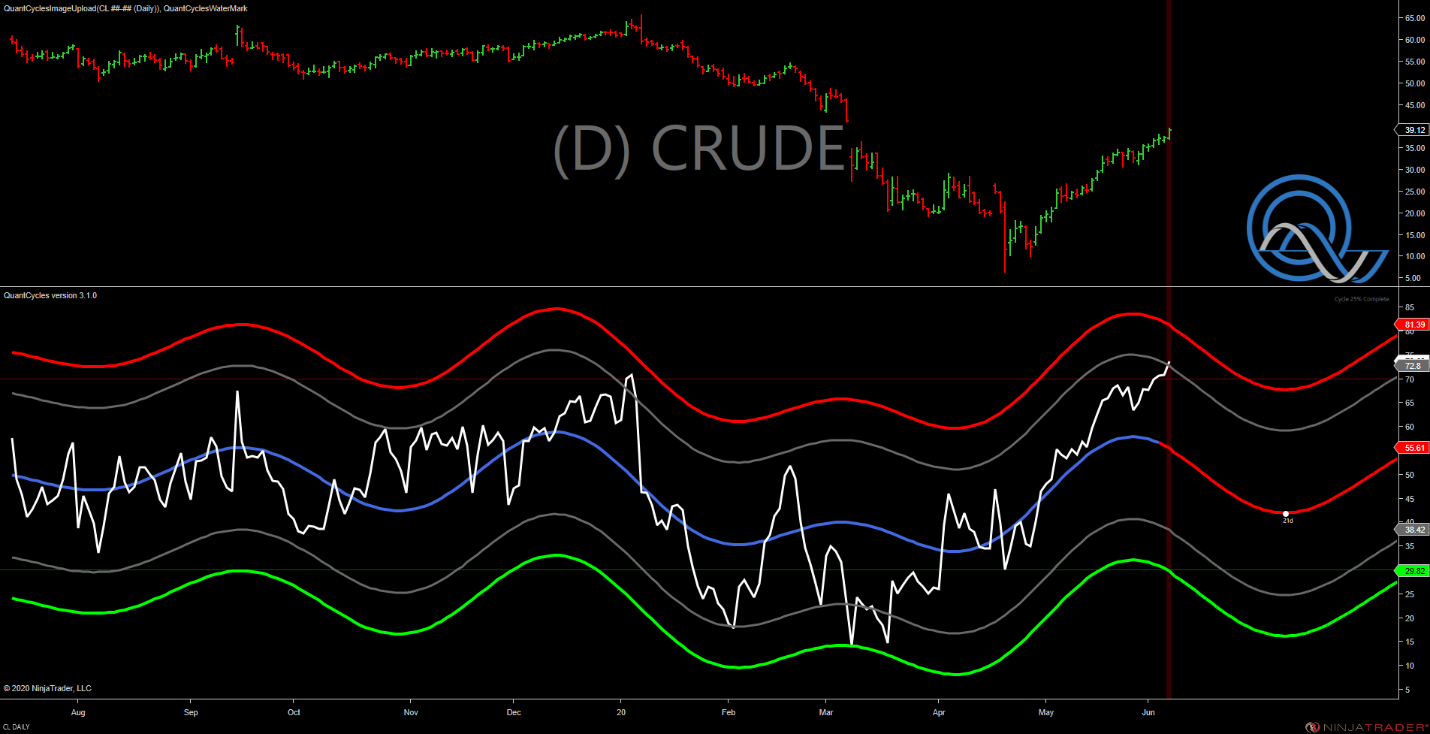
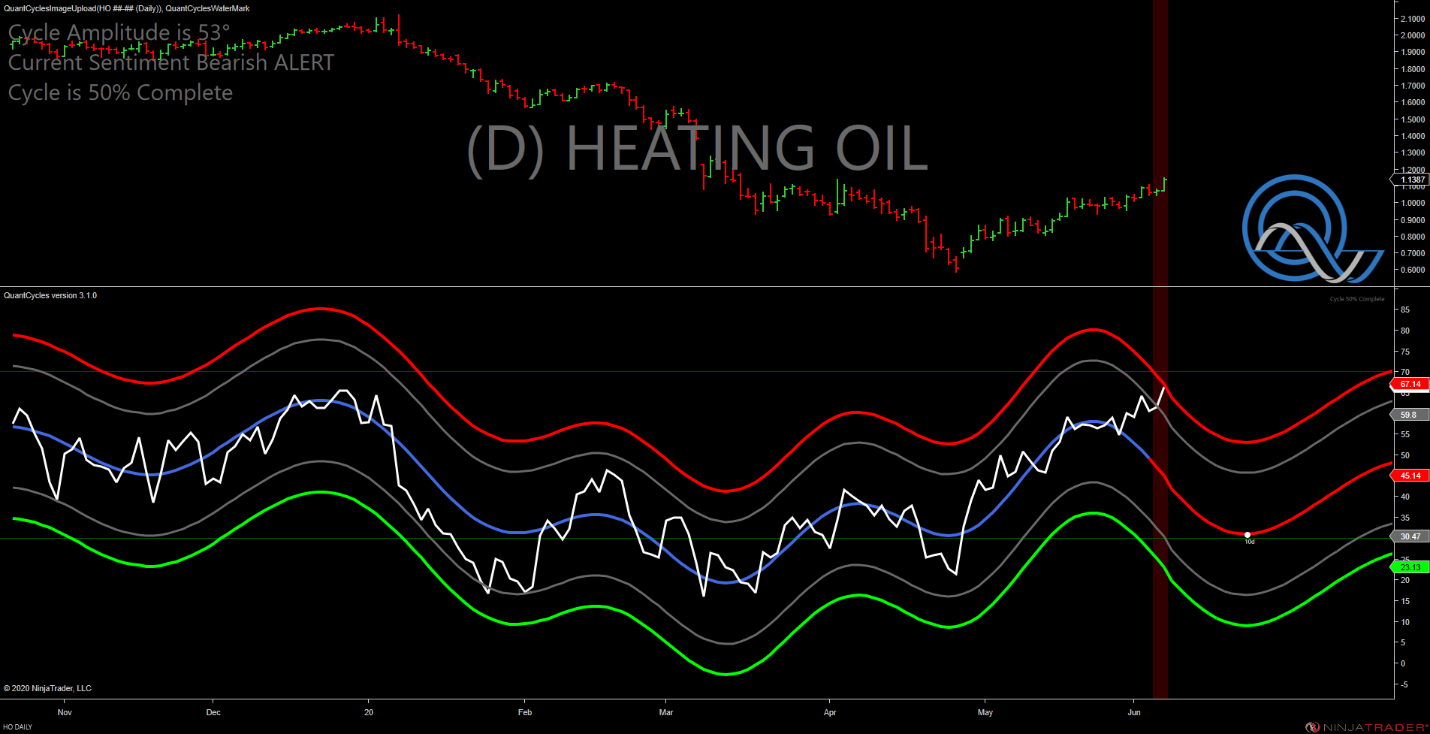
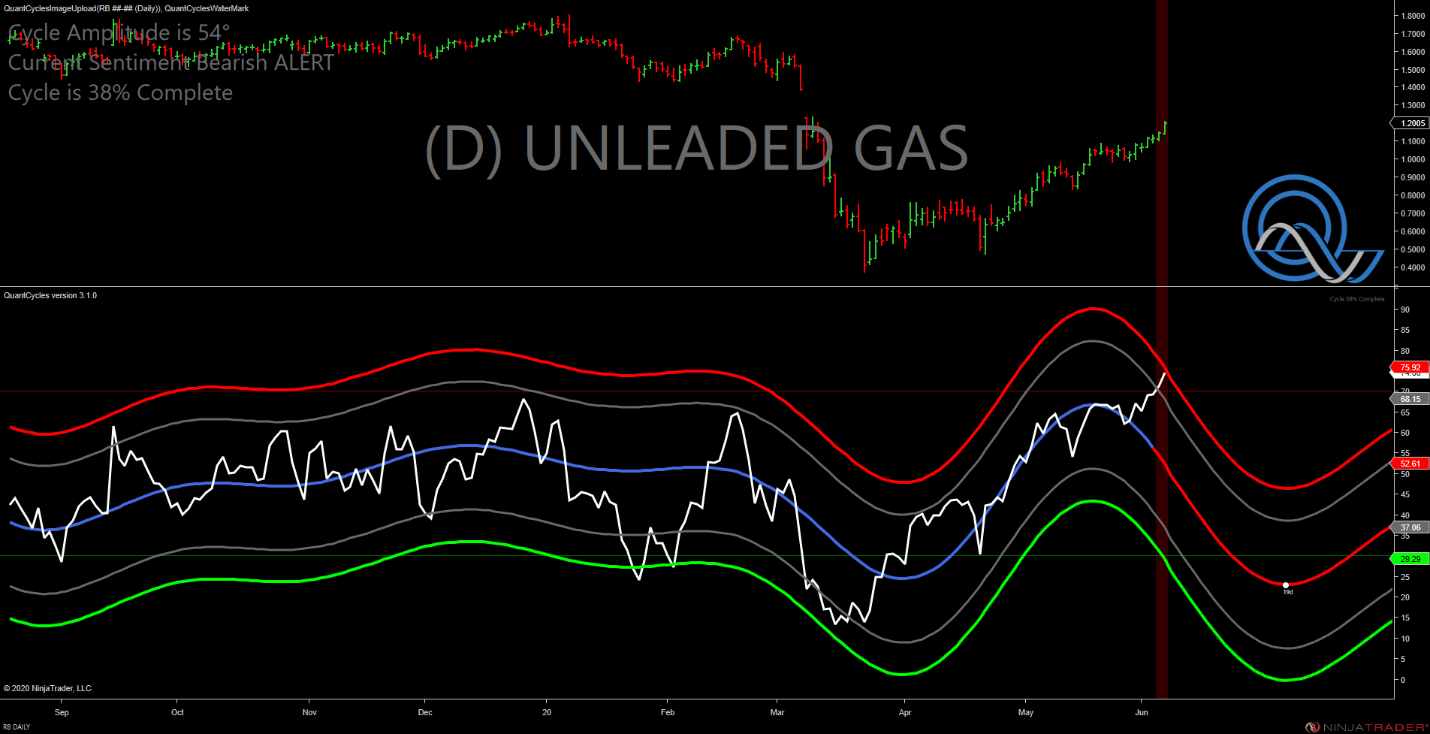
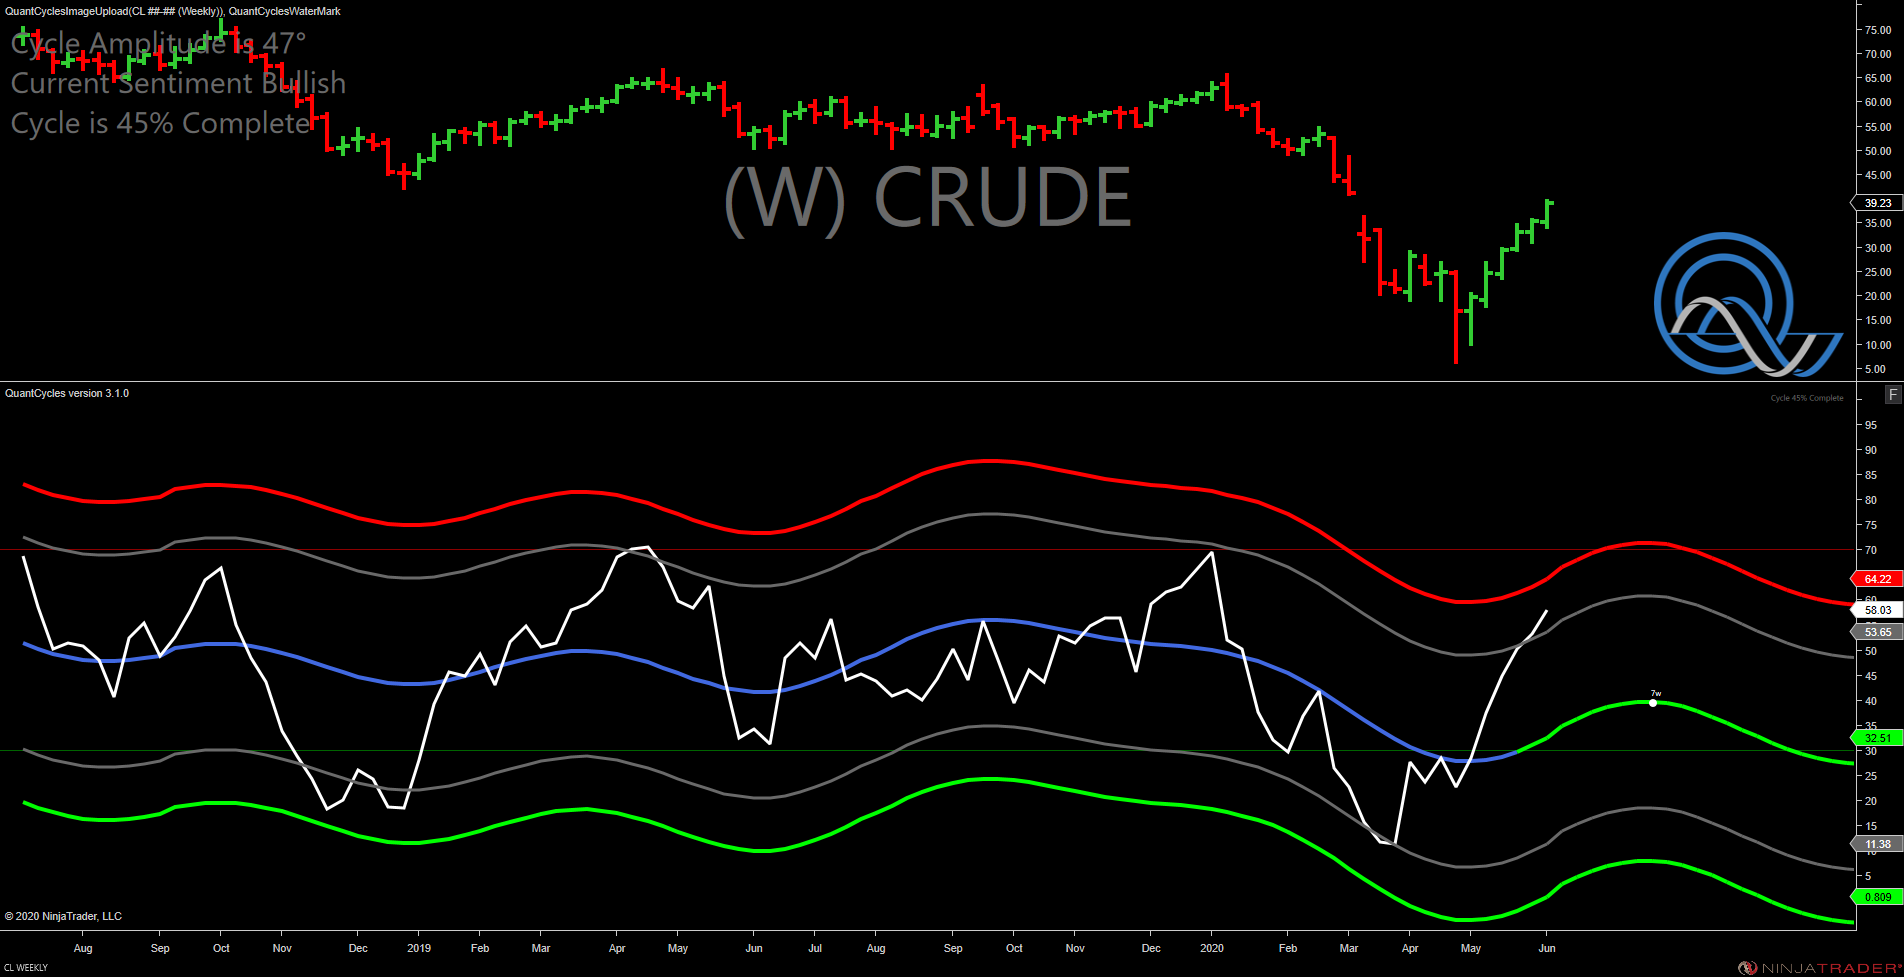
There is a very compelling velocity to these signals, especially considering their overbought nature. However, it appears to be a short term pull back as the weekly analysis on all three continue in an up cycle, despite their being overbought (see charts below).
But keep this in mind; the long-term Dow Jones oscillator has been negative for quite some time. The recovery in stocks appears to be—based on QuantCycle Analysis — a reaction to the oversold nature of stocks and not a trend shift.
What the means is, while energy futures have a short-term sell signal in the midst of a recovery, that move may be significant and last longer than one might expect.
John Rawlins described the value of the QuantCycles Oscillator recently at The Orlando MoneyShow.
The QuantCycles indicator is a technical tool that employs proprietary statistical techniques and complex algorithms to filter multiple cycles from historical data, combines them to obtain cyclical information from price data and then gives a graphical representation of their predictive behavior (center line forecast). Other proprietary frequency techniques are then employed to obtain the cycles embedded in the prices. The upper and lower bands of the oscillator represent a two-standard deviation move from the predictive price band and are indicative of extreme overbought/oversold conditions.


