
Gold futures took a big hit in the aftermath of last week's Federal Open Market Committee (FOMC) meeting, explains Bernie Schaeffer, founder and CEO of Schaeffer's Investment Research.
The meeting was punctuated by a press conference at which Chairman Jerome Powell disappointed anyone who may have been anticipating a hairpin shift from rate hikes to rate cuts on the part of the central bank.
Following that Wednesday afternoon announcement, the SPDR Gold Shares (GLD) gapped lower at Thursday's opening bell, and settled the session at a year-to-date closing low of $119.94, narrowly below support at the round $120 level.
While GLD whittled its single-day post-Fed slide from 0.71% to 0.38% over the course of Thursday's session, the dip in precious metal prices was sufficient to spark GLD's first day of net outflows since April 26, per etf.com data.
The ETF racked up net outflows of $48.48 million on the session, bringing its total net outflows since March 20 — the date of the last FOMC announcement — to roughly $1.34 billion (GLD, which invests in physical gold, has assets under management totaling around $30.76 billion).
At last Friday's close of $120.65, GLD was down 0.5% on a month-to-date basis. It's still early innings, but another negative return in May would mark GLD's fourth monthly loss in a row — its longest losing streak since the six-month slump that kicked off last April.
From a seasonality perspective, the odds are stacked against GLD. Over the past decade, GLD has closed the month of May on positive ground only 30% of the time, and its average return for the month is a decline of 1.10%.
Based on April's close, another "average" May for GLD would place the shares around $119.87 by month's end -- which would mark its first monthly close below $120 since last November, incidentally.
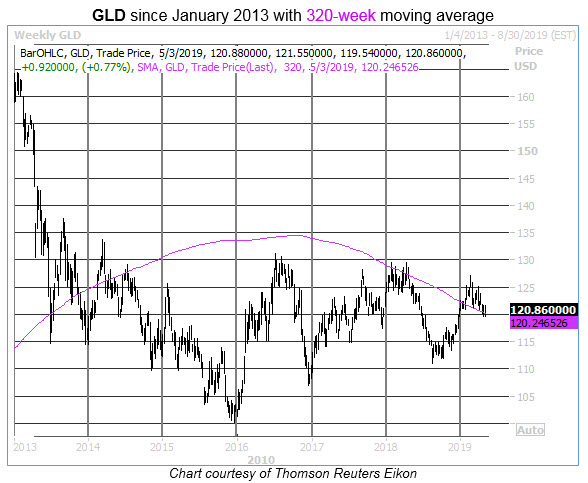
Calendar-based projections aside, it's very interesting to observe what's happening on GLD's chart right now with the 320-week moving average. This long-term trendline acted as stiff resistance throughout the first four months of 2018, and was finally broken to the upside just a few months ago, in late January.
Since then, the 320-week has been re-tested as support in early March and again over the past several weeks, and it has successfully held up as a technical floor for GLD.
Which makes it more interesting still that options players seem downright unenthused about the upside prospects for GLD.
Total call open interest of 1.47 million contracts registers in the low 22nd annual percentile, while comparable put open interest of 888,7444 contracts arrives in the much more robust 73rd percentile of its 52-week range.
And among near-term options, our Schaeffer's put/call open interest ratio (SOIR) for GLD stands at 0.93, in the 100th annual percentile — suggesting short-term traders are extremely heavily tilted toward puts over calls.
Then there's short interest, which — despite dropping by 13.4% from its mid-February highs — remains 41.6% above the 8.76 million-share low from last November, which is where short interest has repeatedly bottomed since January 2018.
All of which is to say that the market seems to be "all in" on a bearish price move for gold, even as GLD shares showed resilience on Friday by gapping higher and closing above both the $120 level and their 320-day moving average (which was key support on a May 2018 bear gap).
With technical and sentiment indicators poised at possible pivot points, it should be interesting to see how GLD's newfound strength on the charts to start the month of May holds up to traditional spring headwinds.


