Shares of Charles Schwab are in play after posting a strong bullish buy signal on a well-respected auto-trading system.
Although I’m partial to the trading systems I've designed for the futures and stock markets, I have to admit that I am extremely impressed by the Rahul Mohindar (RMO) trading system that comes standard with MetaStock 11. It normally buys on strength and sells on weakness and has shown itself to be a strong contender in the very crowded market for trading systems. When used with a variety of confirming indicators and analysis techniques, the RMO system appears to become even more effective, so try it out for yourself and see if it fits your own unique trading style. In the meantime, here's a brief look at a recent list of RMO swing buys in the Standard & Poor's 500.
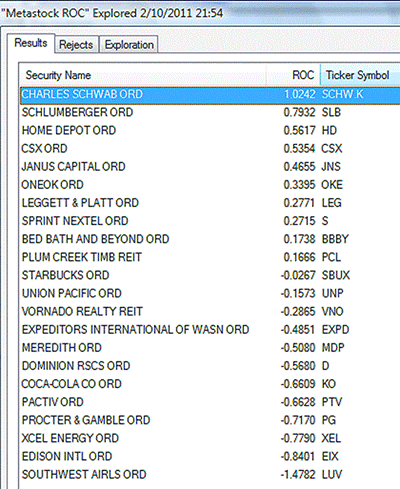
As you can see, shares of Charles Schwab (SCHW) have the strongest 13-week relative strength ranking vs. the S&P 500 among all RMO swing buy candidates.
Technically speaking, the intraday price action in the S&P 500 and Russell 2000 indexes suggests that the broad markets are either consolidating prior to another push to new post-crash highs or they are beginning to stall out after completing an amazingly strong run higher since July 2010. Instead of attempting to predict the ultimate outcome of the current market configuration, however, maybe it's better to just look at what's being offered right now, leaving the predictions to others.
SCHW is the strongest relative strength (RS) stock in all the S&P 500, giving new RMO swing buy signals late last week. A simple 13-week (one calendar quarter) rate of change (ROC) calculation is used to rank the stocks in MetaStock Explorer.
Daily Chart Analysis: Charles Schwab (SCHW)
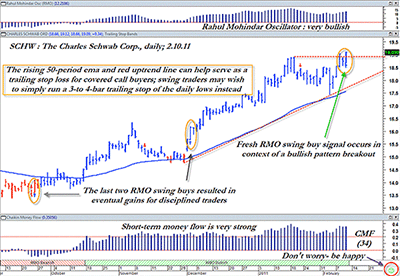
There's not a bearish bone to be found anywhere on this daily chart. All of the probabilities suggest that a long entry is the logical choice, depending on a trader's risk tolerance.
This chart template in Figure 2 should be very familiar to regular MoneyShow.com readers, as I've used it several times to highlight various RMO swing buy/sell trade set-ups in a variety of stocks, indexes, and futures contracts. The indicator at the top is the RMO, and it is currently in an extremely bullish mood, as the higher the RMO, the stronger the momentum and trend strength of a given market. At the bottom of the chart is the short-term Chaikin money flow (CMF)(34), which is also exceptionally bullish, being far above its zero line. Just beneath that, the RMO expert advisor (green ribbon with the smiley face nearby) is also displaying an "RMO bullish" confirmation.
As far as the actual price action on the chart, what we see is a strong relative strength stock in a confirmed uptrend (higher highs and higher lows) that also features strong momentum and money flow characteristics and has just busted higher from a small consolidation pattern. In other words, this is not the ideal time to attempt to pick a top in these shares! No, the only sane choice here is to attempt to ride this evident strength higher by way of either a covered call (for conservative types) or a swing and/or trend trade kind of play.
Bid/ask spreads in SCHW calls are reasonably close, but be prepared to work a bid to get a better price on this March $19 covered call, especially if you're skilled at reading intraday charts.
For those who want to just play the stock all by itself, why not wait for a minor intraday pullback on a 30-minute chart and then consider entering a long position, risking no more than 1% of your account equity? When filled on the order, you might consider using a three- to four-bar trailing stop of the daily lows as your guide for when to exit the trade. Such a stop can help give you an objective, emotion-free way to manage the trade, regardless of the outcome.
For covered call enthusiasts, why not take a look at the March 2011 SCHW $19 covered call, attempting to buy it for $18.50 or better? (These are prices at the time of this writing. Be sure to confirm real-time pricing prior to executing any trades.)
The annualized rate of return for this five-week buy/write opportunity comes in at almost 27% (before commissions). The chart itself has already provided you with a very easy-to-use trend line/moving average combo to help you stay in the trade for as long as is practical (see chart for details), and with the initial risk on this trade being only about $1.35, this looks like a terrific and painless way to manage the entire trade from start to finish. See Figure 3 above.
Will this particular trade set-up make money? No one knows for sure, but given the way all of the probabilities are stacked in favor of a long entry right now, it's pretty safe to assume that more than a few traders are going to avail themselves of the ongoing strength in shares of this financial services giant.
By Don Pendergast of ChartW59.com


