The charts show that these five stocks are near important technical levels where tradable moves may soon be presented.
By Greg Harmon of DragonflyCap.com
After reviewing over 700 charts, I have found several good set-ups for the coming week, five of which are below. These were selected and should be viewed in the context of a broad market macro picture that looks for gold to continue higher and crude oil to head to $100 with a break of $88.50.
The US dollar index will look for support and US Treasuries to maintain support, both to avert disaster. The Chinese market looks set to go higher with emerging markets continuing to consolidate with a bias higher if they finally break the range. Volatility looks to continue to be muted, facilitating a continuation of the trend higher in the US equity ETFs.
And now, the trading ideas:
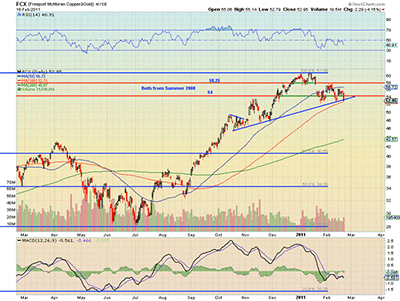
Freeport McMoran Copper & Gold (FCX)
Freeport McMoran is falling through the uptrend support. Under the 100-day simple moving average (SMA) at $52.71, it has support at $50.40 and then $47.52. The Relative Strength Index (RSI) is heading lower and the Moving Average Convergence/Divergence (MACD) is starting to turn negative. Use the trend line as a stop area.
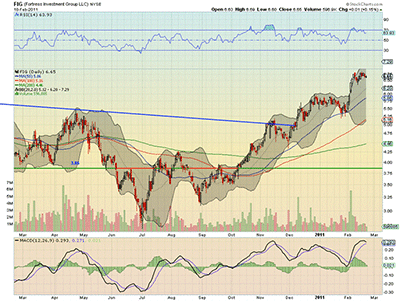
Fortress Investment Group, LLC (FIG)
Fortress Investment is flagging after a move higher. If it can get through $6.75, then the target on a measured move is $8. The RSI is solidly in bullish territory, but the MACD is moving towards zero and is about to cross.
Article Continues on Page 2
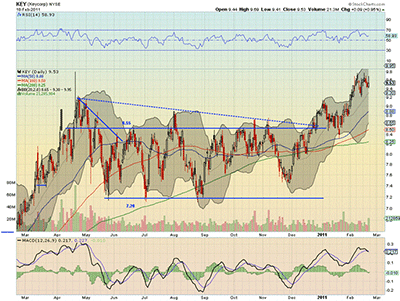
|pagebreak|Keycorp (KEY)
Keycorp has pulled back off of $9.75 for a second time but with a higher low. If it can hold support at $9.40, then it can try to move higher again, and if it gets through $9.75, the stock has a target on a measured move at $10.75. If it loses $9.40, then look for a move lower to $9.00. The RSI is bullish, but the MACD has just crossed lower.
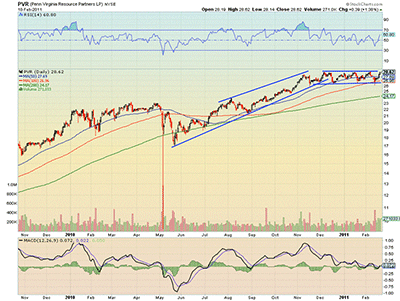
Penn Virginia Resource Partners (PVR)
Penn Virginia Resource Partners has been in a consolidation channel between $26.60 and $28.90 since December. It is now moving to the top of the channel with a bullish rising RSI and a MACD that has crossed higher. If it can get through $28.90, then the target on a measured move is $38.
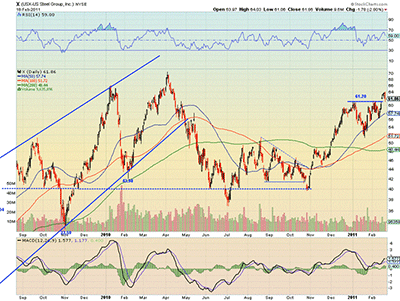
USX-US Steel Group, Inc. (X)
US Steel broke through resistance at $61.20 last week, retested it as support, and held. If that support continues, then the target on a measured move is $71. The MACD supports a move higher and the RSI is in bullish territory, but it is heading for a test of the midline at $50. If the $61.20 level does not hold, then look for support lower at the 50-day SMA at $57.74.
By Greg Harmon of DragonflyCap.com


