With popular Treasury ETF TLT at an important support level, traders and investors should watch closely, as a break of support could trigger a larger drop, while a successful test could spur a move higher.
The iShares Baclays 20+ Year Treasury Bond Fund (TLT) is a popular proxy for traders and investors to watch for bond prices, or to use as a hedging or trading vehicle.
Let’s take a look at the recent “rounded reversal arc” in price, which now challenges its first potential support target on this past week’s recent breakdown.
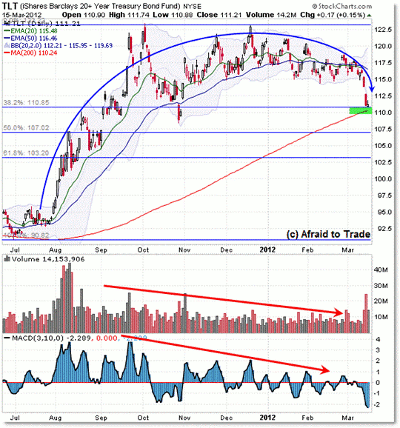
Here’s the daily chart arc pattern into support:
“Rounded reversal,” or “rounded arc” patterns are a type of distribution pattern that represents an orderly transfer from demand (buyers) to supply (sellers).
The alternate way for price to reverse is a more violent “spike,” which we often call a “V-spike reversal.”
Anyway, you can see how the lengthy negative divergences developed during the agonizing flat or “consolidation” period from November 2011 to present, which culminated in this week’s strong support breakdown.
At the moment, the TLT chart is challenging its first/initial downside target near $110, which is the overlap of the rising 200-day simple moving average (SMA) (important) and 38.2% Fibonacci retracement, as drawn.
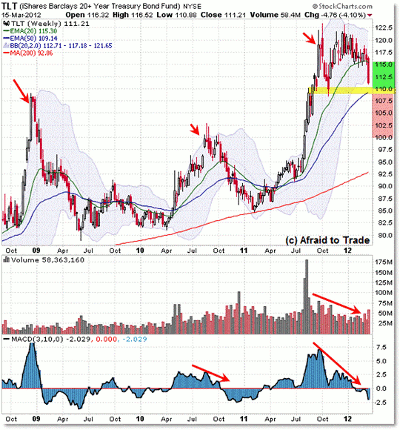
The weekly chart also shows a similar confluence with the rising 50-week exponential moving average (EMA):
The rising 50-week EMA also comes in at the $110 level ($109.15 now), which makes the $110 region the critical potential support price level to watch.
As with all confluence or price pivot levels, we often drop to lower time frames to assess the chart picture/signals there.
At these critical chart junctures, price can either support/bounce off of them (an aggressive trade for short-term bullish traders) or else break sharply through them (a breakdown entry for bearish traders).
Generally, when price firmly breaks under a confluence support level, it continues on to lower respective targets which would immediately expand to $107.50, $103, and perhaps even as low as $100 again.
But don’t get ahead of the price until we get official signals via breakdowns of these levels. For now, watch how price trades relative to the $100 confluence in TLT, either retracing up off of it for the moment, or crashing down through it to lower levels.
By Corey Rosenbloom, CMT, trader and blogger, AfraidToTrade.com


