Apple has long captured the public's imagination, whether it's the intuitiveness and sleek design of its products or speculation about its stock's recent slide, and Erik Swarts of MarketAnthropology.com offers insights on where its stock price will eventually come to rest.
What has become practically an "Apple-a-day" occurrence, we hear from some corner of the market—either an analyst, pundit, grandmother, or guru, who makes an attempt to pick the or a, low in Apple. And while we can appreciate a good pick as much as the next guy—we don't see a ripe one just yet. Today, the fundamental rationale to own Apple may look quite compelling. From a treasure trove of cash, to the underlying products even our two-year-old can navigate and enjoy. However, the simple fact remains—it has a broken spine. The backbone of which we speak is the great humbler of prognostics and man—momentum. You will often find her (the humbling gender) at work in the parallel universe, where price defies logic—on both the up and downside.
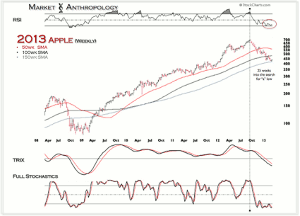
If our memory serves us, Apple diverged from an arguably already exuberant growth path directly after its visionary and genius marketer passed away on October 5, 2011. Over the next year, the stock (which just happened to be the largest public market-cap company in the world, as well as the most widely held security by hedge funds) roughly doubled from the intraday low on his death. Did it make much sense based on the fundamentals of Apple's known and extrapolated market share or the underlying governing future of the company at the time? Certainly not—but momentum was at its back.
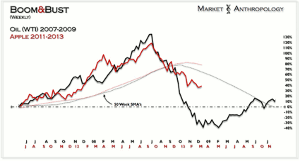
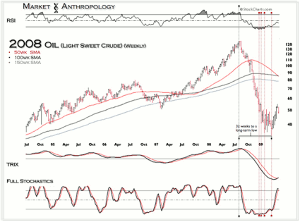
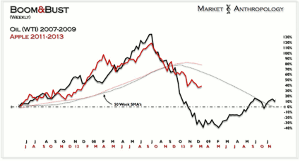
The same market psychology and trend dynamics could be said for the oil comparative we have frequently used to presciently remain on the right side of the stock. Back in late 2007 as the equity markets were starting to cough out and the first signs of an economic downturn were becoming readily apparent, oil—the literal fuel for the economy, started its parabolic ascent. With hindsight 20/20, it was anything but rational and largely a herded stampede—spearheaded by hedge funds both large and small that were bidding the commodity markets to Icarus heights and the US dollar to its secular low.
NEXT PAGE: Comparing 2 Previous Parabolics
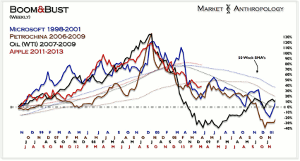
So it comes as no surprise, that the most recent signatures of one of the last large crowded canyons are leaving similar momentum footprints on both the front and backside of the parabolic face. This is largely captured in the final culmination phase and expressed with similar moving average profiles and stubbornness towards the downside without much relief for retracements. For greater comparative purposes, the series was refitted to the cycle highs and normalized to reflect the final parabolic build.
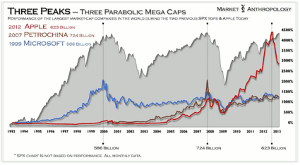
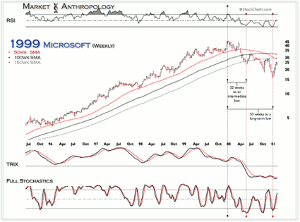
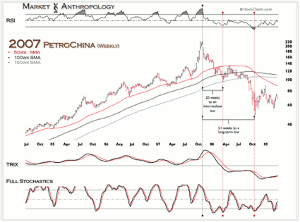
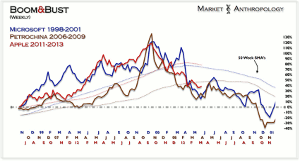
To add further color, we took a quick check under the hood at the two previous parabolics, Microsoft (MSFT) and PetroChina (PTR), that roughly marked each respective cycle highs.
Taking a look at how momentum built and drained from the two other mega caps—as well as oil in 2008, we find a few similarities and contrasts.
Both Microsoft (MSFT) and PetroChina (PTR) broke down roughly along similar timelines and with like price and momentum structures. Approximately 21 weeks to an intermediate low at their respective 150-week SMAs—and approximately one year to exhaust the down cycles. Each weekly low was also accomplished with successively lower RSI imprints.
In contrast, Apple (AAPL) is currently 25 weeks into the move with the previous low reflecting a positive divergence. However, the low to date was also presented—like Microsoft (MSFT) and PetroChina (PTR), at its 150-week SMA.
Like Apple (AAPL), oil never quite came up for a breath on its way to a long-term low—some 32 weeks after its cycle high. This persistent selling pressure was reflected in a severely impacted RSI that eventually (on its fourth positive RSI divergence) made a long-term low.
For the sake of comparison, we kept the same performance snapshot from the Apple/Oil comparative. As reflected in their price structures and long-term moving averages—Microsoft (MSFT) and PetroChina (PTR) broke down and bottomed along similar folds.
Although not as severe a decline as oil to date, Apple (AAPL) reflects the frictionless, albeit slower, one-way street lower. With that said, we would not be surprised if an intermediate-term low is reflected—as in Microsoft (MSFT) and PetroChina (PTR)—with a lower RSI imprint.
Where Apple (AAPL) eventually comes to rest for this down cycle is still uncertain. But based on both the oil and the two previous parabolic mega-cap comparatives—downside pressures should remain for some time.
As always—Stay Frosty—and careful picking. The fruit may still have a worm or three.
By Erik Swarts, Trader & Blogger, MarketAnthropology.com


