

With all eyes on next week’s FOMC meeting, Corey Rosenbloom of AfraidToTrade.com makes the case for why there won’t be a tapering any time soon.
As we debate the outcome of the Federal Reserve’s policy announcement next Wednesday December 18, let’s take a look at six selected commodity price charts that fall on the side of “no immediate change” in ongoing QE3 stimulus policies.
Let’s start the debate!
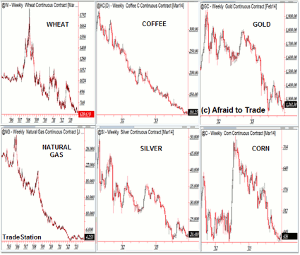
Chart 1
Click to Enlarge
We’re seeing TradeStation continuous contract data for wheat (@W), coffee (@KC), gold (@GC)(GLD), natural gas (@NG)(UNG), silver (@SI)(SLV), and corn (@C) on the weekly timeframe stretching back to the 2011 peak (or even earlier for wheat and natural gas).
The main idea with these charts is that these commodities (DBC) peaked and have been in persistent weekly downtrends (intermediate timeframe) and actually continue to trade at or near recent lows.
We can pull the perspective back further and start our comparisons near 2004:
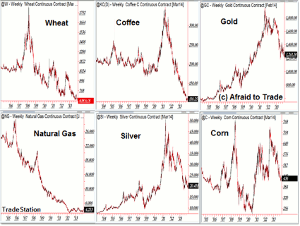
Chart 1
Click to Enlarge
The charts above take into account the 2004-2007 recovery, the 2007-2009 recession/financial crisis, and the stimulus-fueled economic recovery that continues to this day.
Gold and silver particularly rallied strongly with the stock market in the stimulus-fueled economic recovery, but both have diverged with the stock market since their respective peaks in mid-2011.
Coffee and corn have remained volatile, also rallying with stocks during the recovery phase (2009-2011) but both experienced sharp declines as shown above.
Natural gas and wheat have remained weak since their respective 2005 and 2008 peaks and did not benefit from the stimulus-fueled economic rally.
We can see the collective chart of the CRB Commodity Index for an even broader perspective:
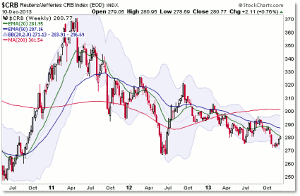
Chart 1
Click to Enlarge
It’s tempting and completely logical to note the improvements in economic data—particularly the unemployment rate, which continues to fall—as the main reason to pull or reduce stimulus.
However, the Federal Reserve has a dual mandate, which addresses not just “full employment” (a relative term) but also price stability.
In other words, the Federal Reserve attempts to combat inflation along with deflation to achieve a goal near a 2.0% annual inflation rate.
The policy of “printing money” (a simplified but incorrect way to view stimulus) to buy Treasury bonds and mortgage-backed securities is aimed not only to lower broader interest rates, but also to create or support inflation (or more specifically, to combat deflation).
When we take into consideration the “price stability” portion of the Federal Reserve’s mandate, we see the argument for continued stimulus via so-called “Quantitative Easing.”
So again, as we study the economic data, charts, and additional factors to weigh the odds of whether the Federal Reserve will either…continue its QE3 stimulus program unchanged; announce a definitive future date to begin “tapering” (or reducing the $85 billion monthly purchases); immediately begin tapering/reducing its monthly purchases at its December 18 meeting, Let’s be sure to take these broader deflationary trends into account.
By Corey Rosen bloom, CMT, Trader and Blogger, AfraidToTrade.com


