

Indicators for this tech stock have given a fresh sell signal—confirming the shift of momentum to the sell side—so the staff at ForexTraders.com charts the stock’s recent performance and offers actionable insight as to how investors could act on this news.
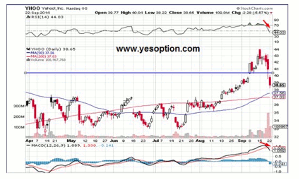
(Figure): Daily chart for Yahoo! Inc. (YHOO)
Click to
Enlarge
Yahoo! Inc. (YHOO) was expected to gain hugely post the listing of the much hyped Alibaba Group Holding Ltd. (BABA). It did list with a 36% premium on the issue price but Yahoo found itself in midst of a strong downtrend and showed no signs of reversal in the near term. The company did reap a total of $9 billion from its stake sale in Alibaba and had assured that most of the post-tax gains would be given back to the shareholders through share buybacks.
But most investors aren’t waiting for that to happen as now they can directly buy into the Alibaba. Many analysts also believe that Yahoo would not be able to regain advertising revenue that it has lost to competitors like Google and Facebook, which is being seen as a huge long-term negative for the company.
On the daily charts for Yahoo, the company has been in a strong downtrend over the last few days, down by close to 10%, on the back of above average volumes, which is a bearish indicator. Many traders believe the next support for the stock would come at around $37.56, which is also the 50-day moving average for the stock. The momentum indicators for the stock have given a fresh sell signal confirming the shift of momentum to the sell side. The relative strength index for Yahoo has given a sell signal indicative of the overall bearishness on the stock.
Actionable Insight:
Short Yahoo! Inc. (YHOO) at current levels for targets of $37 in the very near term.
Long Yahoo! Inc. (YHOO) only if it closes above $39.84 for an intermediate target at $41.80 in the near term.
By the Staff of ForexTraders.com


