It is probably best to avoid any aggressive long-side plays, since the downside potential represents 140 points lower from where we closed on Friday, asserts Avi Gilburt, a widely followed Elliott Wave technical analyst and author of ElliottWaveTrader.net.
While the market is searching for a top before the next larger pullback begins, I have no indications just yet that such a top has been struck. But, I still believe we will revisit the 2300SPX region before we begin the next larger rally phase towards 2600SPX.
After we struck a new all-time high on June 9 and then reversed strongly, many were convinced that the market had struck a major top. However, since the high struck that day was a 3-wave structure, it made it more likely than not that we would see a higher all-time high before any significant top was struck. As we have seen, that perspective turned out to be quite accurate.
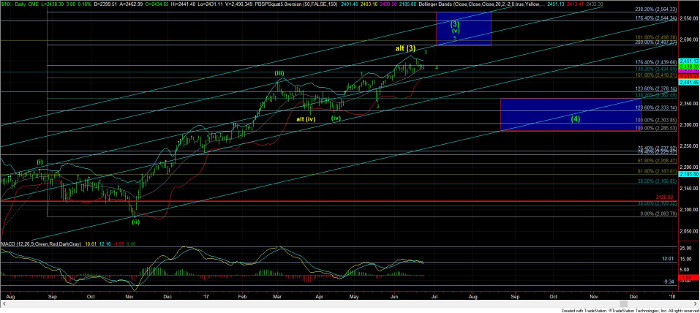
However, we are now in a similar position. The high struck on June 20 was also completed as what counts best as a 3-wave structure. For this reason, I still think that a higher high is sitting out there over the next week or so. While my preference is that any higher high struck is only the completion to wave v of 3 in the larger degree wave (v) of (3) off the February 2016 lows, the closer we get to 2500SPX, the higher the risk we run that wave (v) of (3) completes, and that wave (4) takes us back towards the 2300SPX region.
Yet, what the overlapping structure is saying to use is that the market has run too far too fast. That is often why we see diagonals at the end of a market move. It suggests that much of the buying has been spent in the prior 3rd wave and that consistent buying is waning.
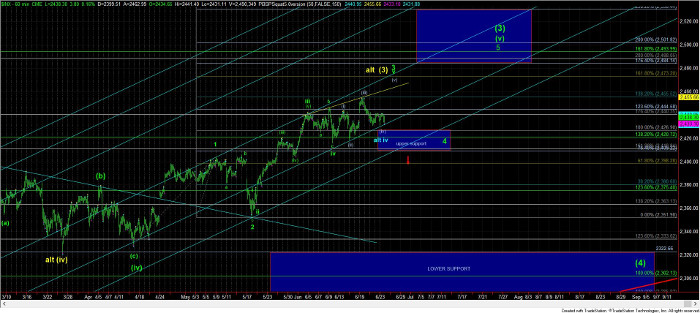
Unfortunately, due to the structure with which we have been dealing since April, the pattern up into the current region has the potential for several interpretations, with the one I have on my chart most aligning with Fibonacci Pinball, at least in my humble opinion. The ideal structure I have been following still has me looking for at least one more higher high (and preferably two more) as long as we remain over our upper support region in the 2410-2427SPX region, to complete waves 3, 4 and 5 of wave (v) of (3).
A breakdown below 2410SPX makes me view the structure as potentially still needing a higher high in a larger ending diagonal for wave (v) of (3), or having already completed that pattern in a shortened format. But, as I explained in prior weeks, I really would rather see us coming much closer to the 2500SPX region before I am comfortable that wave (v) of (3) has completed.
Since we are approximately within the last 50 points before we strike our ideal target for wave (3) set long ago, it is probably best to avoid any aggressive long-side plays, since the downside potential represents 140 points lower from where we closed on Friday.
See charts illustrating the wave counts on the S&P 500.
Subscribe to Elliott Wave Trader here