

If the S&P 500 is unable to sustain above 2,580 into week’s end we would look to close short-term positions, writes Ziad Jasani. Join the Independent Investor Institute for a 3-hour deep dive on markets Dec. 2, 12 pm (EST). Register here.
Watch our Video Market Strategy video recorded Nov. 20 here:
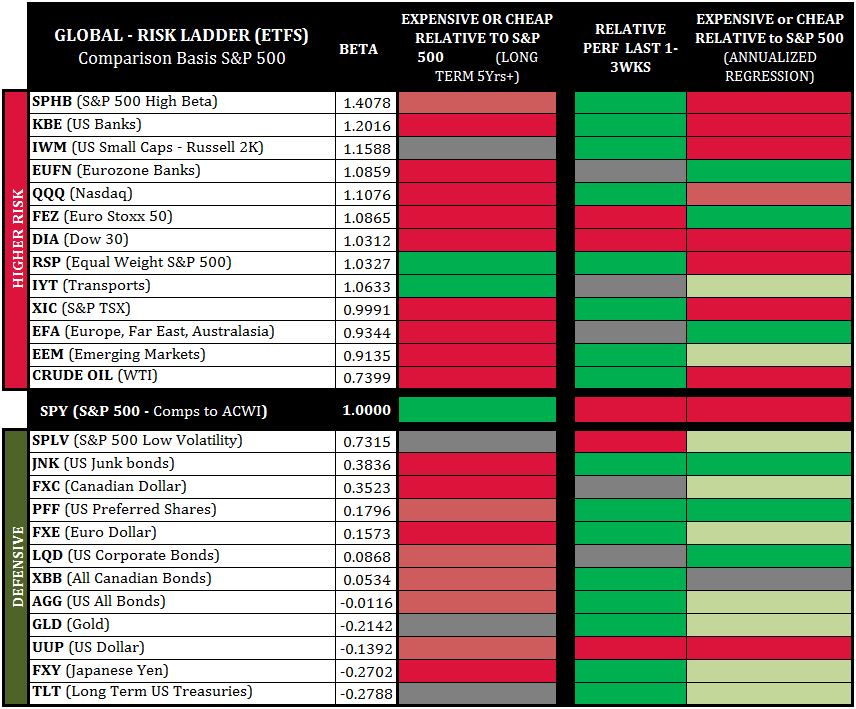
Global Risk Sentiment
Long-Term Equities & Bonds present as expensive, driven by nearly a decade of money printing and “market stimulation” by central banks.
Short-To-Mid-Term (3rd column) Defensive Asset Classes (below the S&P 500 Line) present as relatively cheaper, but awaiting swing-highs on bond yields this week to be uplifted. Higher Risk Asset Classes (above the S&P 500 line) present largely as scattered.
Areas of opportunity short-term are the Eurozone Financials (EUFN), Low Vol (SPLV), Nasdaq (QQQ), EFEA (EFA), Euro Stoxx 50 (FEZ), EEM, PFF, LQD, TLT, XBB-T, FXY and GLD/SLV.
Overall configuration of the Global Risk-Ladder is tilted to risk off, where if the S&P 500 is unable to sustain above 2,580 into week’s end we would look to close short-term positions. And if we see higher risk assets getting further overvalued into week’s end, we would suggest not to chase the move, but rather sell-into-price strength.
We are in risk reduction mode, awaiting a test of the bottom of up-trend channels.
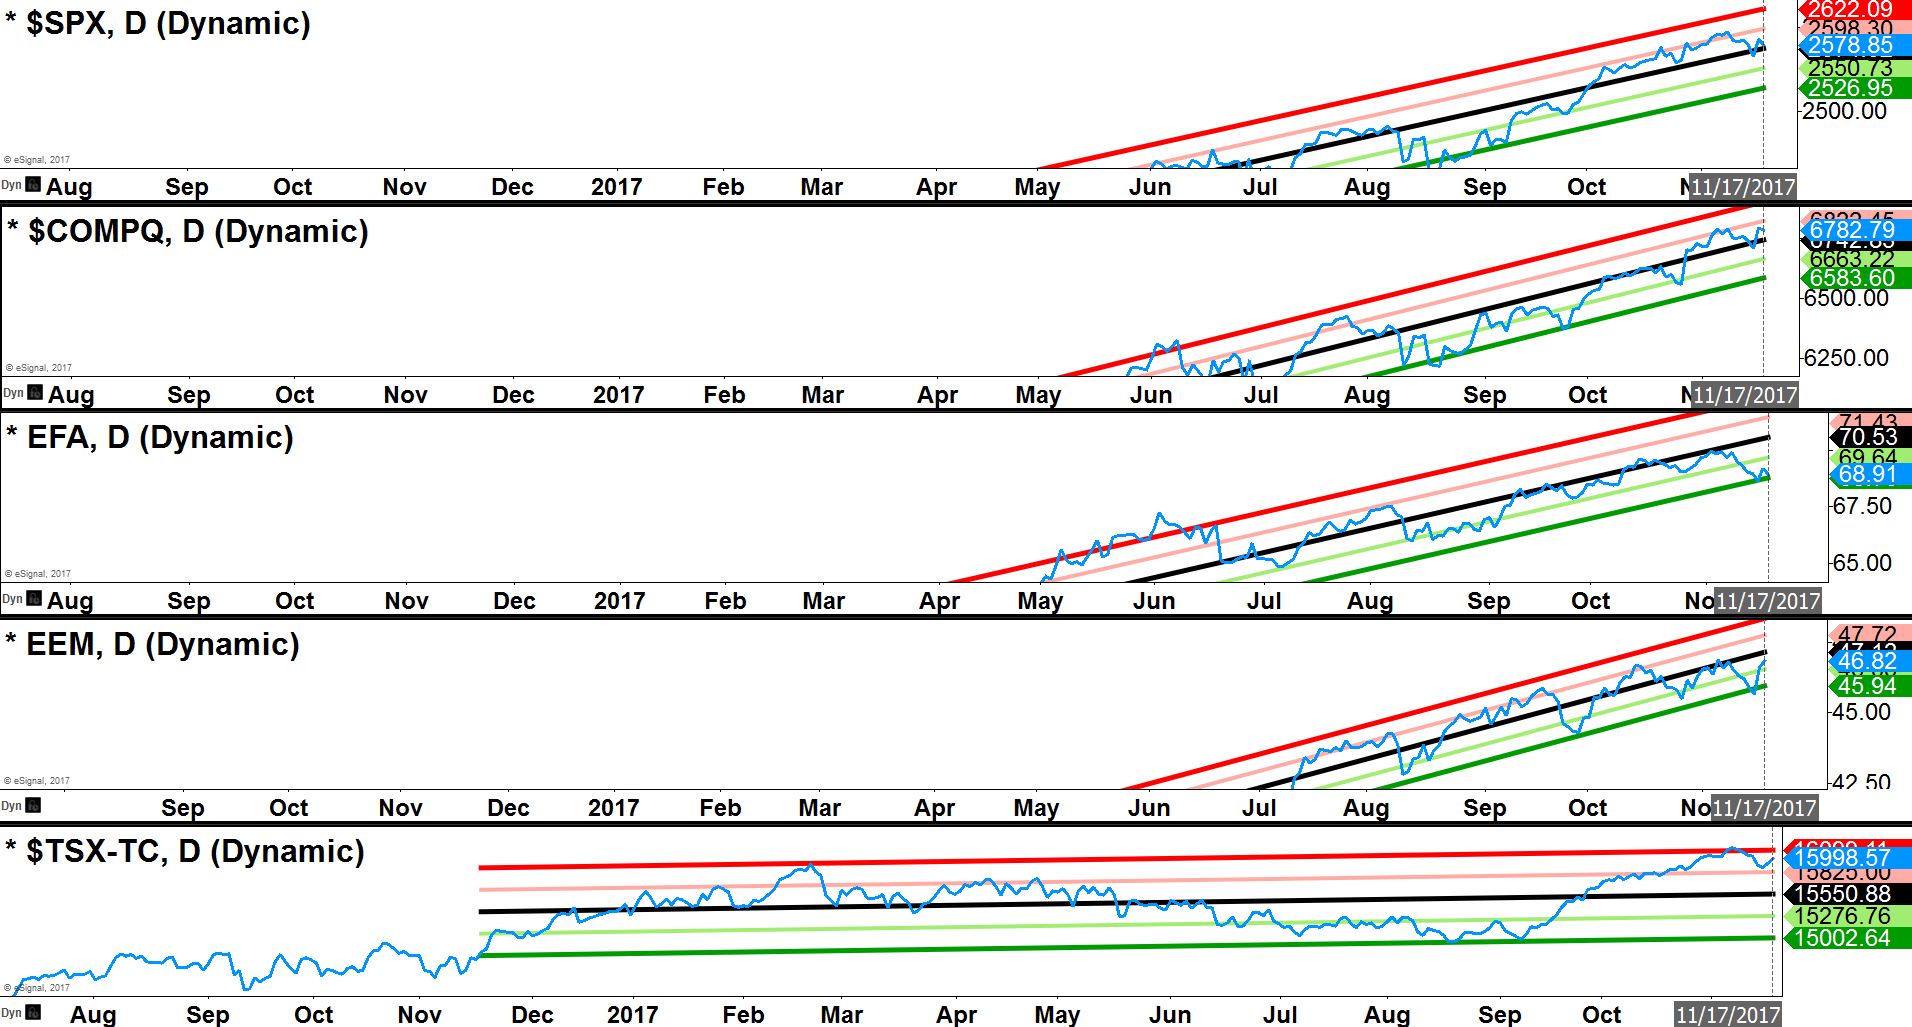
Major Index Direct Price Regression: This tool gives us a quick snapshot of whether major global trading blocs are on the cheaper or expensive side of annualized routines.
The bulk of spaces present as neutral, with EFA cheap and the TSX expensive. This implies that positive catalysts would be welcomed to keep markets near highs, but if medians on the S&P 500/Nasdaq up-trend channels are broken, we see a test of the bottom of the channels.
Using short-term capital to play bounces or break-outs makes more sense than investing at these highs; conversely price negativity is not likely to start a pullback (-3% to -5%) or correction (-10% to -15%), but a drawdown (-1% to -3%) is realistic once the S&P 500 bearishly reverses below the 2,570 mark.
We can look for opportunity long in EFA, EEM and short in the TSX over the next two weeks.
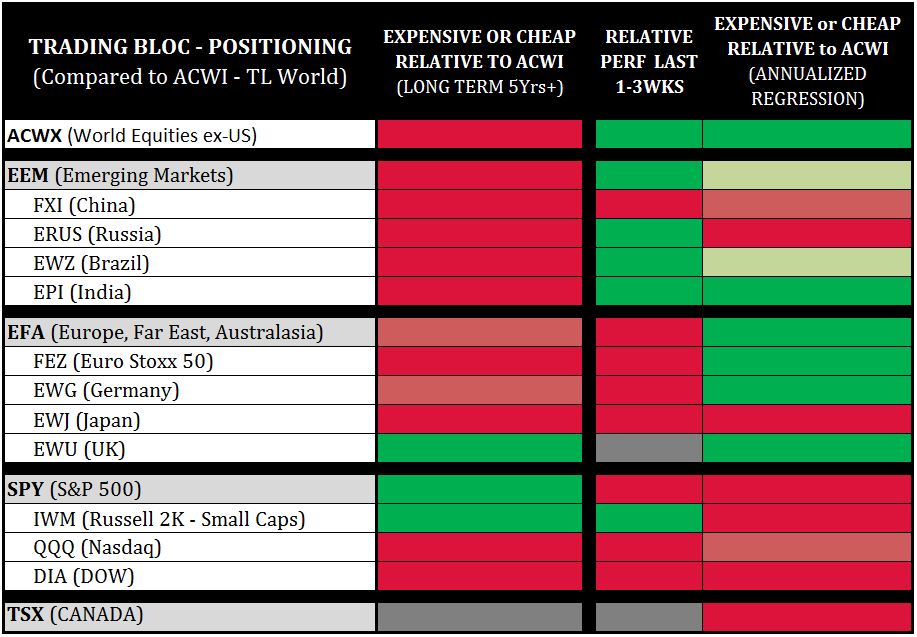
Trading Bloc Positioning: When comparing major trading blocs (EEM, EFA, SPY, TSX/EWC) to the entire world of equities (ACWI) we are able to identify which blocs are relatively cheaper (easier path for money to flow in) vs. which blocs are relatively expensive (harder for money to flow in).
The third column within the chart depicts Emerging Markets (EEM) & the Eurozone Far East & Australasia as cheaper (EFA).
While North American Markets (SPY, DIA, IWM, TSX) present on the expensive side.
If the USD softens this week, as we expect, and if equity markets remain pointed north EFA, EEM would be better trading opportunities.
Portfolio managers are better off using short-term capital to trade EEM, EFA and start selling-into strength within the S&P 500, TSX, and even Nasdaq. The TSX is over-due for a pullback of -3% to -5%.
Join experts at the Independent Investor Institute for a 3-hour deep dive on markets Saturday, December 2, 12 pm (EST). The session will be held online. Register here. Or send Ziad an email with your request: ziad.jasani@educatedtrader.com


