

The overall market still has gas in the tank. If the Dow Jones Transport Index (DJT) is going higher, according to Dow theory, there isn’t too much to worry about for the time being, says Jeff Greenblatt, editor of The Fibonacci Forecaster Wednesday.
Tax reform has passed the Congress and is a major victory for GOP-controlled Congress and President Trump who gets a major legislative victory in his first year in office. More important, the stock market never had the chance to have a hissy fit in the event it didn’t happen. As you know this has been at the top of the list in this column all year long.
It’s representative of a year where a lot of things could’ve gone wrong, but didn’t. It now appears the longer-term calculations we were watching in September and October turned into inversions as the market has powered through November and December. An inversion simply means the cycle turns upside down as what could’ve been a high, turns into an acceleration point.
As we know, the stock market is a leading indicator which means the economy should stay strong until the middle of next year.
We haven’t looked at the bond market, but it has been lower since September which means they are pricing in higher rates. Looking at it from a deeper perspective, with tax reform the bond market is bullish on the economy. That’s why it’s lower.
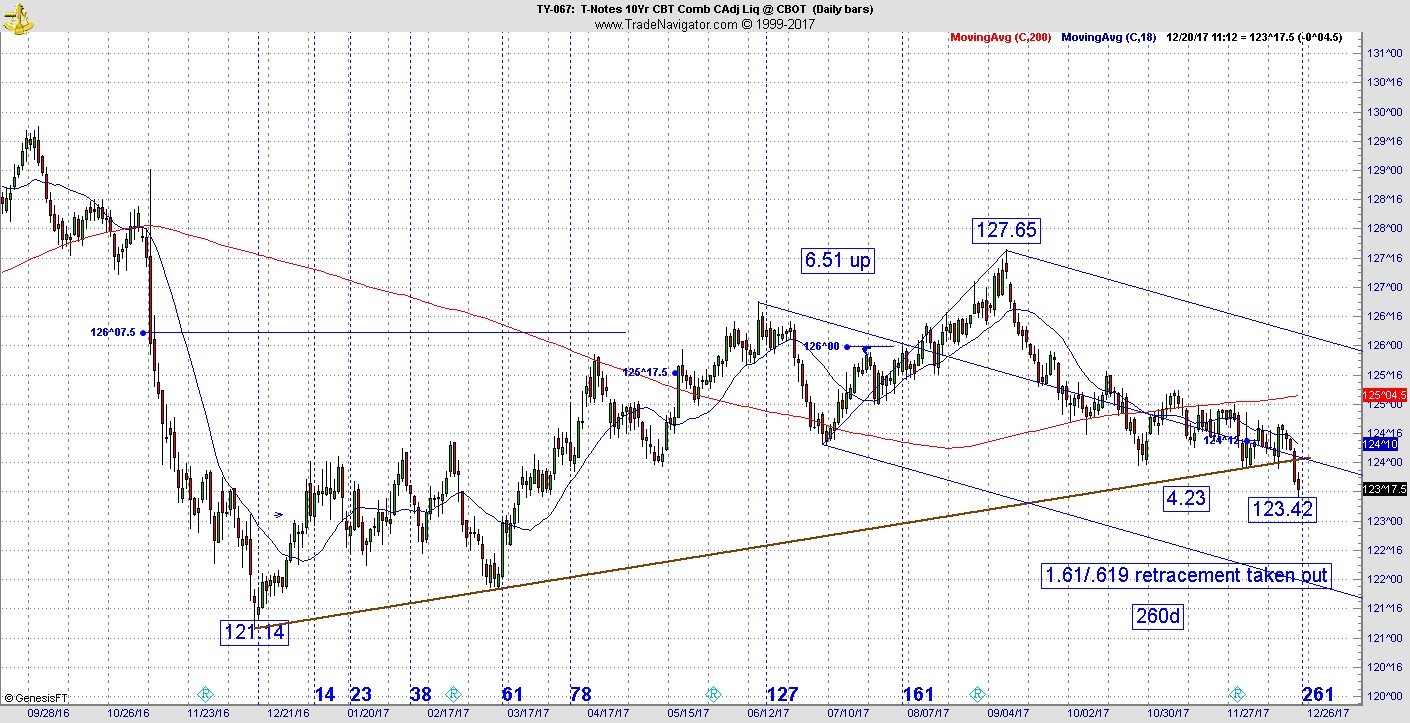
It could be a double-edged sword. How high can rates go before it chokes off the housing market? We are going to find out. But we are at a very interesting inflection point. As you can see from this chart of the continuation 10 year, the intermediate term connect the dots trend line was broken this week. Just as well, with Tuesday’s close we were at a perfect 61% retracement. With Wednesday’s violation that now becomes a 65% retracement. It’s also at 260 days.
Here’s something important to think about. Had the pattern reversed up today, we would be at a 61% retracement at 260 days, a picture-perfect turn. Now, not so much. It may or may not respond to 261 days.
Why are we talking about this? With the trend line break, this is the kind of calculation that should’ve held. But when major trends do change, there is always the point where support/resistance breaks.
My levels are a little different than some because I look to cycles, vibrations and square outs. When something good doesn’t materialize, there is usually a reason for it. Depending on what comes next, this could confirm a very long-term top in the 36-year bull market for bonds.
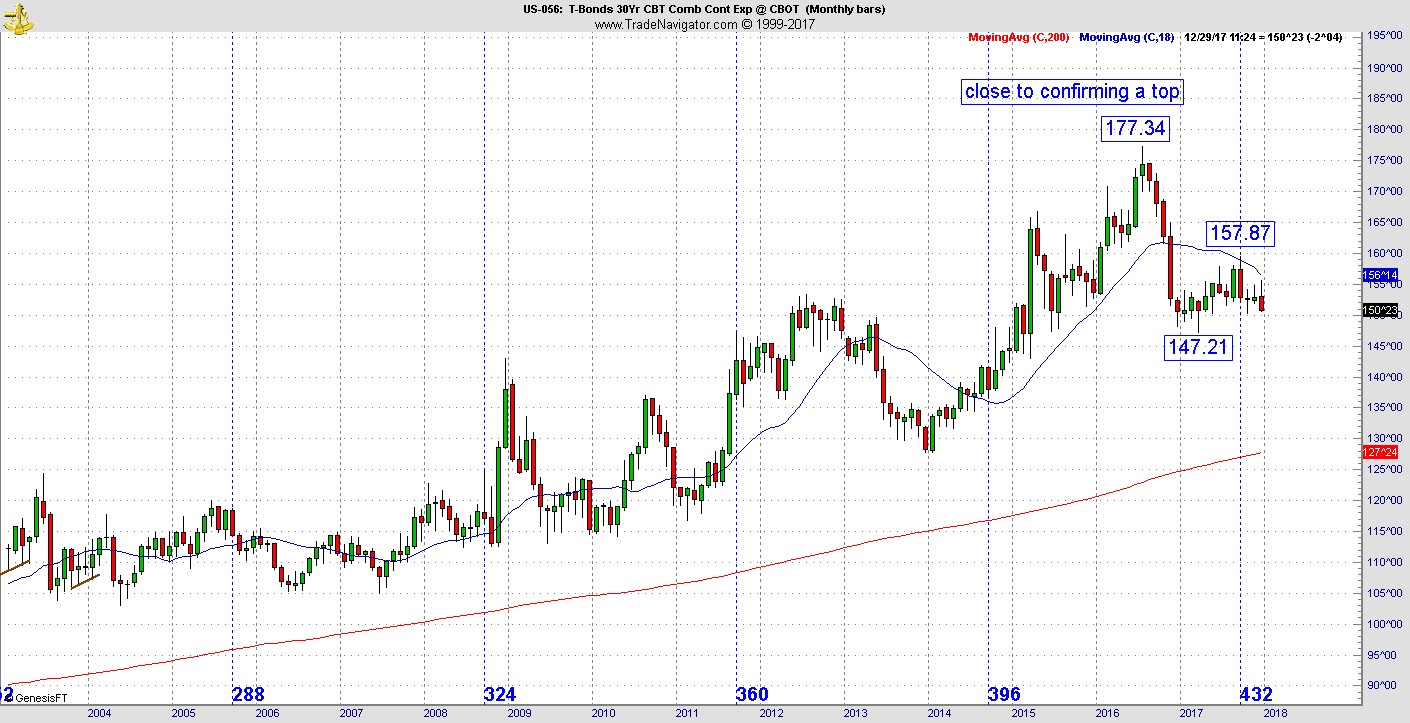
Here’s what is starting to concern me. On a monthly chart, there is a secondary high that formed at exactly 432 months off the bottom which is an important Gann number (144*3). As you can see, the price action has been lower ever since. When we put the two charts together we see a major inflection right now as the 261-day window hits.
We’ve long discussed the Fed behind the eight ball as far as raising rates. The recovery over the past 8 years has been the slowest since WWII. Rates should not rise unless the economy shows signs of overheating, but the Fed needed to keep the powder dry in the event the economy turned south again.
In terms of psychology, market participants got queasy seeing easy money policies so many years after the financial crisis. Now the economy is showing signs of improving so the Fed can raise rates. The issue is how much can it absorb? It will be one of the major issues for the next 12 months.
For now, the overall market still has gas in the tank. Not shown today is the Transports which blew out one of my potential vibrations for a high. If the Dow Jones Transport Index (DJT) is going higher, according to Dow theory, there isn’t too much to worry about for the time being.


