

The daily S&P500 Emini futures candlestick chart is the most overbought ever. The cash index has never been this overbought since 1923, by far the longest streak of the S&P index. Therefore, it is unsustainable and unlikely to continue much longer, asserts Al Brooks.
Monthly S&P500 Emini futures candlestick chart:
Extremely strong rally, but at top of bull channel
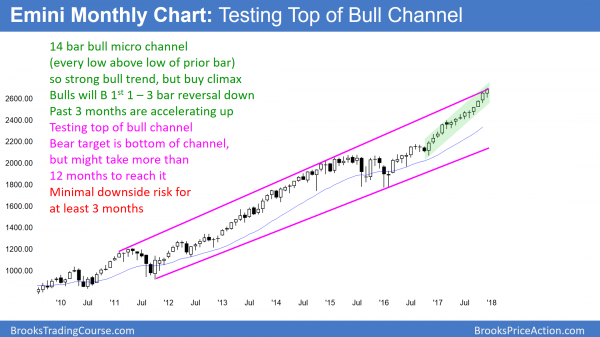
Every low for the past 13 months is above the low of the prior month’s low on the monthly S&P500 Emini futures candlestick chart. This means the bull trend is strong, but it is climactic. The rally is testing the top of the 8-year bull channel.
The monthly S&P500 Emini futures candlestick chart has never been this overbought in its 18-year history. In fact, the cash index has never been this overbought since it was established in 1923. The longest prior streak without at least a one bar pullback was 13 months.
The current streak is 14 months with no sign of a top. Because it is beyond the prior limits of behavior, it is unlikely to continue much longer. There is a 70% chance of a pullback within the next few months.
Pullback means pause, not reversal
A pullback simply means that a month trades below the low of the prior month. The bulls have been so eager to buy that they have been buying above the prior month’s low for over a year. Despite the extreme buy climax, they will be happy to finally be able to buy below the prior month’s low.
Consequently, the bears will probably be unable to hold the Emini down for more than 2 – 3 months. As a result, any reversal will more likely be a bull flag than a bear trend. This means that the first pullback will lead to a test back up to the all-time high.
When a bull micro channel lasts 10 or more months and the rally resumes up from the 1st pullback, the Emini usually pulls back again within 5 months. This means that the Emini will probably be more volatile starting in the spring. Less likely, the test of the high will break out into another sustained leg up.
Weekly S&P500 Emini futures candlestick chart:
Likely final bars of buy climax
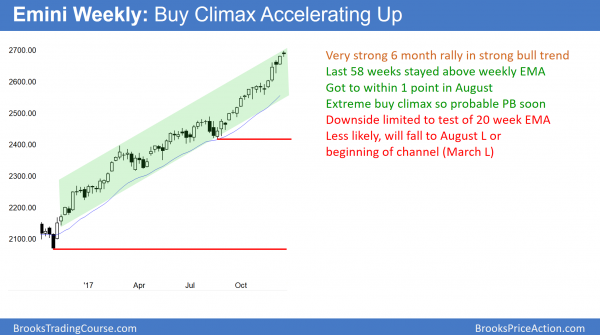
The weekly S&P500 Emini futures candlestick chart is in a strong bull trend. However, this past week (Dec. 18) has bad follow-through buying after the previous week. This is the same as 2 and 3 weeks ago. Consecutive buy climaxes increase the chance of an evolution into a trading range soon.
The weekly S&P500 Emini futures candlestick chart has not touched its 20-week exponential moving average (EMA) in 58 weeks. It got to within 2 ticks in August. The longest streak in the 94-year history of the S&P cash index was 62 weeks in 1995 and 1996. The 1996 pullback began in the 55th week, and it needed 7 weeks to get down to the EMA. If the current streak took 7 weeks to reach the EMA, the streak would end at 65 weeks. That would be the longest in history.
Because this rally is so extreme, when the pullback begins, the selloff could be quick. As a result, it still could achieve its goal of touching the EMA in less than 62 weeks. That is not important. What is important is that the current streak represents behavior more extreme than at any time in history. It will likely end in the next couple of months.
20 gap bar buy setup
There is a gap between this week’s low and the EMA. When 20 or more bars have gaps, it is a sign of strong bulls. As a result, the bulls usually buy once the pullback reaches the average price. The current streak has 57 gap bars, which is far more than 20. Because it is so extreme, the bulls might be exhausted. Consequently, they might not buy right away at the EMA.
Exhausted bulls usually wait to buy aggressively until after the pullback has at least 10 bars and two legs. This means that the pullback will probably last 2 – 3 months. In addition, it will probably fall at least 20 – 50 points below the EMA. Since the EMA is more than 100 points below the high, the pullback will probably be at least 100 points and maybe 5 – 10%.
Bull trends usually become trading ranges, not bear trends
Bull trends rarely become bear trends without first transitioning into a trading range. The bulls want the pullback to last only a month or two and become a bull flag. However, it might be deeper and last longer. If so, instead of a bull flag, the reversal could instead be the start of a trading range.
Therefore, even if there is a 200 point selloff, it will more likely just be a bear leg in a trading range than the start of a bear trend. This means that it will lead to a bull leg in the developing trading range. Since a trading range usually needs at least 20 bars create a major trend reversal setup, the risk of a bear trend is small in the 1st half of 2018.
Daily S&P500 Emini futures candlestick chart:
Trump Emini rally could end with government shutdown
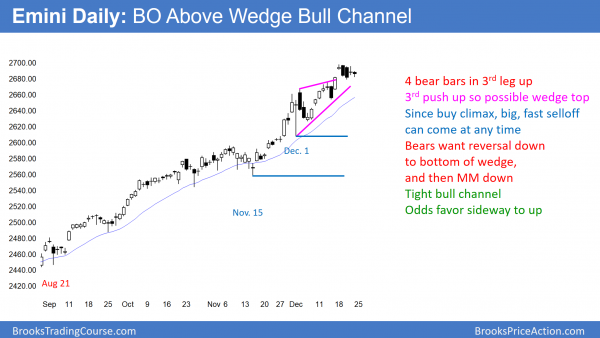
The daily S&P500 Emini futures candlestick chart had 4 consecutive bear bars this week. However, 2 were dojis and this is a 5-day tight trading range. This is also the 3rd push up from the December 1 low. It is a wedge rally. The Emini has not had a 3% correction in 282 trading days, which is a record.
The week between Christmas and New Year’s Day usually has the smallest volume of the year. Most of the days spend most of their time in tight ranges. Therefore, that is what is likely this week.
The daily S&P500 Emini futures candlestick chart is the most overbought it has ever been. In addition, the cash index has never been this overbought since it began in 1923. There has not been a 3% correction in 282 trading days and 416 calendar days. This is by far the longest streak in the 94 years of the S&P index. Therefore, it is unsustainable and unlikely to continue much longer.
December has had big swings up and down. Increased volatility late in a bull trend means bears are becoming stronger. This increases the chance of a pause in the bull trend, or even a reversal on the daily chart. However, there have been many reasonable tops this year, and every one has failed.
This is what traders should expect. Markets have inertia and are very resistant to change. Consequently, my 80% rule says that 80% of tops lead to bull flags or trading ranges and not bear trends. The bears need consecutive big bear bars before traders will begin to believe that a correction might be beginning. Until then, the odds favor at least slightly higher prices.
January 19 vote on a government shutdown
The vote on the federal budget is a major financial event. Congress postponed it to January 19. If they cannot pass the bill, the government will shut down, which will likely cause a selloff for a few weeks.
Even if they pass the bill and there are no surprises, the bulls might take profits. This means that there could be a selloff after the vote, even if the bill passes and it is a good bill.
The rally over the past month has been extreme. The bulls are probably exhausted. They might wait 10 or more bars before buying again. In addition, the Emini might become quiet before the budget vote. Hence, it might enter a tight range going into the mid-January vote.
Watch Al Brooks discuss how to trade common patterns that form during the first hour in his talk at the recent TradersExpo Las Vegas here
Traders can see the end of the day bar-by-bar price action report by signing up for free at BrooksPriceAction.com.


