

Betwixt and between might summarize the mood of investors and even analysts. Various arguments have a ring of validity. There’s something simply uncomfortable about markets in this news-sensitive, hence choppy, market environment, writes Gene Inger in IngerLetter.com.
Technicians will point to trends that are either overbought daily, less so in a weekly or monthly viewpoint, and speculate whether new all-time highs are possible.
Bloomberg: U.S. stocks decline of tech woes, Treasuries slide Thursday.
Most have already dismissed concern about the 200-day. That key moving average has enough cushion developed that it is lost from their vision.
Fundamentalists will cite the generally positive earnings, while credit market guys and gals will focus on lower rates that suggest no immediate concern requiring the Fed to do much of anything.
Let me summarize where these things are at the moment.
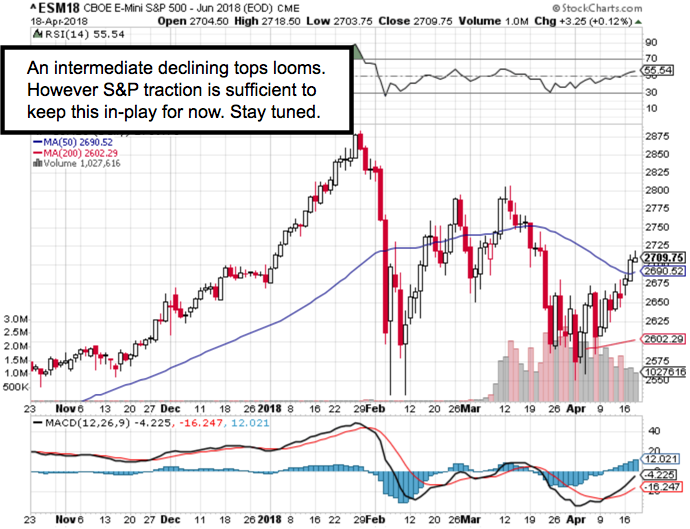
First of all the latest sequence of Hail Mary rallies has lifted the June S&P enough so that it broke out to the upside of the symmetrical pattern we had drawn for nearly a couple weeks (declining tops and rising bottoms). It is both within the June S&P 2700-2710 targeted resistance for this week, and at the upper-end of a standard deviation envelope.
Having this occur with relatively light volume (and alternating shuffles for the most part every day), generally suggests not just a lack of conviction by either buyers or sellers, but potentially an exhaustion pattern reflecting more conviction by sellers. Those sellers get periodic reprieves with rallies that are both inducing shorts to cover, but have no follow-through. Sellers show themselves again as they continue to whittle down their holdings.
During this time, you’ve seen one of the most dramatic leverage erosions of recent times.
This is interesting on the surface because it would suggest a degree of caution and (perhaps academically intelligent) trimming-back of exposure. Generally, it is that. But such behavior also implies they’re not a bit enthused about using leverage to bolster the upside now. Hence, you also don’t get the reprieves having particular staying power.
The most notable aspect of what I just observed is that leverage tended to vanish at more than one significant top historically. It is generally becoming a feature between 1-6 months before the actual crest and reversal. That’s not exactly the case here if one believes the top was (as we contend just on a secular basis) on January 25-26.
So, ironically those who expect a top still ahead (near-term; not lifetime of course) could suggest that contracting use of leverage is more recent. So, January wasn’t the peak. I would point out that’s almost irrelevant, other than perhaps for traders, because that point of view also argues the S&P 500 (SPX) generally in the area of a high, whether the precise high was it or not.
I find this topic amusing since internally so many sectors topped-out last year on a rotational basis, with the indexes buoyed. First by reawakening the slumbering old-line heavy equipment and industrial stocks upon the Trump presidential victory. Then buybacks of course. And then the renewed push into the FANG+ stocks, which provided cover for some of the earlier movers to consolidate.
The fundamentals are experiencing relief, not so much from what really is a more-mixed sequence of quarterly earnings reports than advertised at the same time. Guidance is a bit iffy as we suspected would occur.
For sure technology will lead America in the ongoing growth phase, but that’s not to say they’re not getting primed for a setback for an interim period.
Some stocks that are more social media or consumer-related face concern about the impact of the new European privacy model coming to America soon.
Those privacy rules will be complied with even if U.S. law doesn’t require it. This improvement in consumer/user control isn’t being discussed perhaps because of concern it would press margins of those stocks.
We all know the prime candidates dependent on data-mining.
Facebook to follow privacy rules in Europe, then everywhere else.
Facebook (FB).
The Amazon numbers
Your annual reminder of how far the Amazon jungle has spread, by Dylan Byers of CNN:
• Size: 560,000 employees, 2 million sellers.
• Salary: The average Amazon Seattle HQ employee makes more than $100,000 a year. The median salary for its worldwide workforce is $28,446.
• Prime: 5 billion+ items shipped with Prime worldwide in 2017.
• Amazon Web Services: “A $20 billion revenue run rate business.”
• Amazon devices: “Tens of millions of Echo devices” sold in 2017.
• Prime Video: “Rights for more than 3,000 feature films” in 2017.
• Amazon Music: “Tens of millions of paid customers.”
• Whole Foods: No specific numbers.
• Amazon Go: No specific numbers.
• India: “Amazon.in is the fastest growing marketplace in India, and the most visited site on both desktop and mobile, according to comScore and SimilarWeb.”
And don't forget live sports ...
• NFL Thursday Night Football on Prime Video had more than 18 million total viewers over 11 games. ... New this morning: Amazon Prime has secured exclusive TV rights to the US Open in the UK and Ireland for five years.
Bonus: Amazon retail chief Jeff Wilke talks to Bloomberg Businessweek about the company’s AI ambitions ...


