

Traders need to see 2 – 3 consecutive bull trend bars before they will be confident that the breakout will succeed. If they get that, the rally will probably continue up to a new high this summer, writes Al Brooks Saturday.
Monthly S&P500 Emini futures candlestick chart:
Emini bull flag buy signal after microchannel buy climax
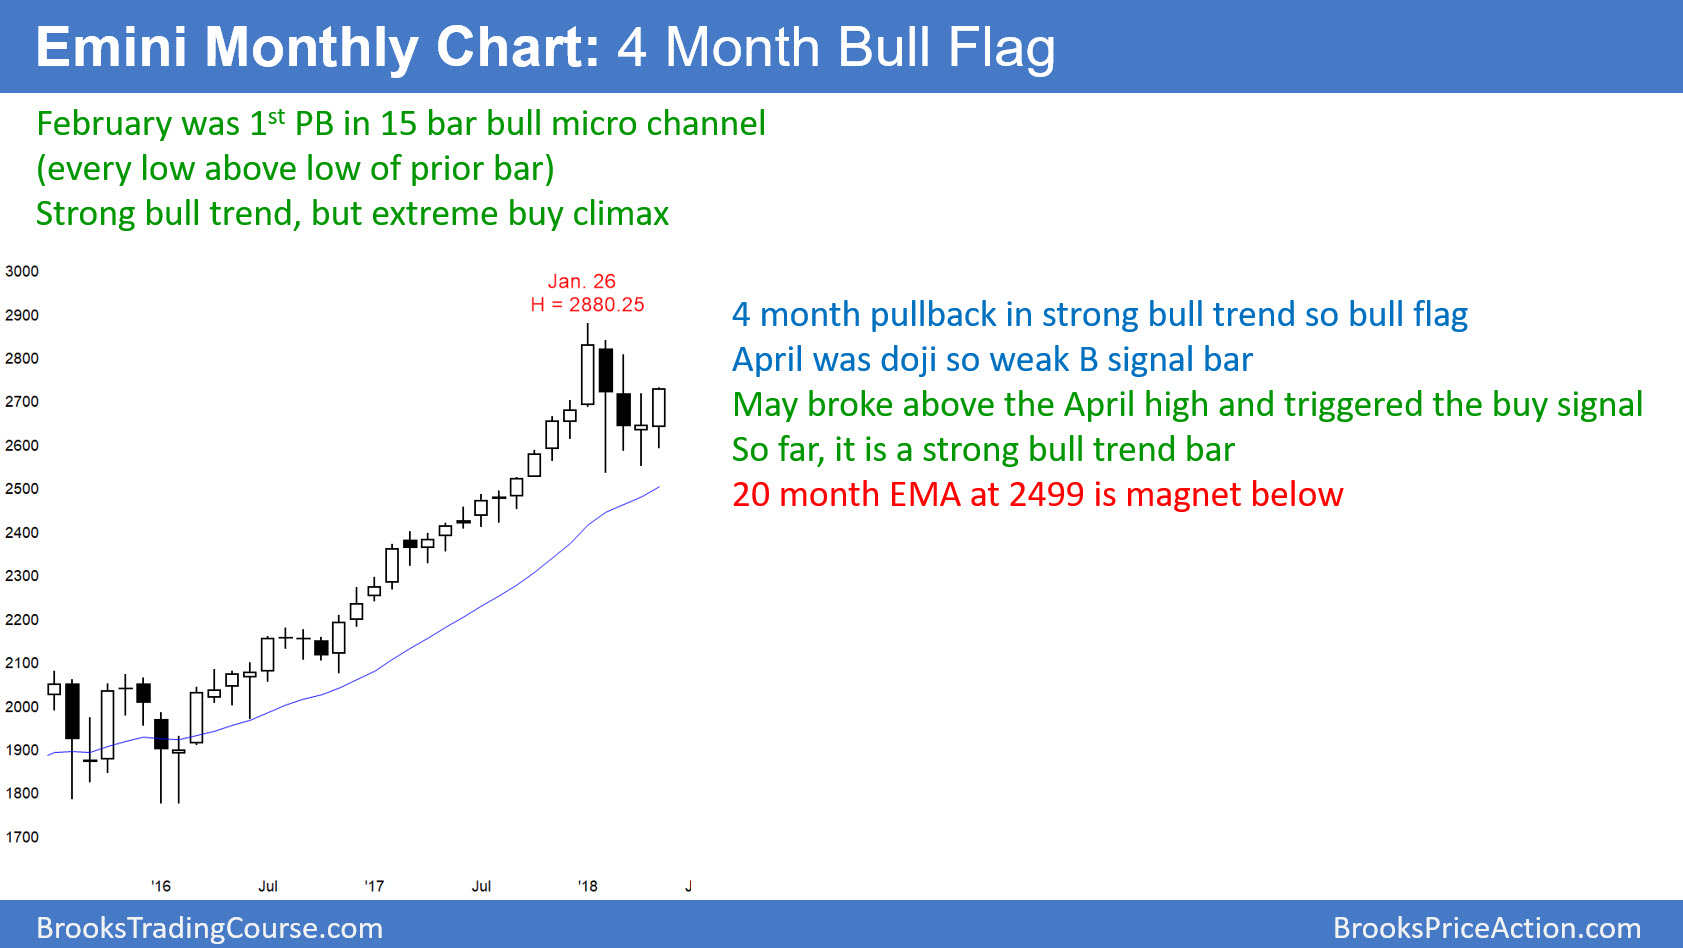
The candlestick on the monthly S&P 500 Emini futures chart so far this month is a bull trend bar. Since it broke above last month’s high, it triggered a monthly buy signal. The three-month pullback is a bull flag in a strong bull trend.
The monthly S&P 500 Emini futures candlestick chart traded above the April high after a three-month pullback in a very strong bull trend. Because there has been no clear top, there is only a 20% chance that the selloff will continue down into a bear trend. Since the 20-month EMA is not far below, the bears might get one more leg down to that support over the next several months. Even if they do, the selloff will still be a bull flag. Consequently, a new high is more likely to come before there is a 20% correction.
Since April was a doji bar, it has less chance of leading to a strong rally than a strong buy signal bar. However, the bull trend on the monthly chart was exceptionally strong. When that is the case, buy signal bars in bull flags are often not strong bull reversal bars. Yet, the trend can still resume and make a new high.
The probability of a new high will be greater if May closes near its high and becomes a bigger bull trend bar. If instead it closes below the April high, the Emini will probably continue sideways for at least a couple more months. Alternatively, if May closes near its low, the probability will shift in favor of the bears. The Emini would then probably test the 20-month EMA, which is below the February low.
Weekly S&P 500 Emini futures candlestick chart:
Breakout of a three-month triangle
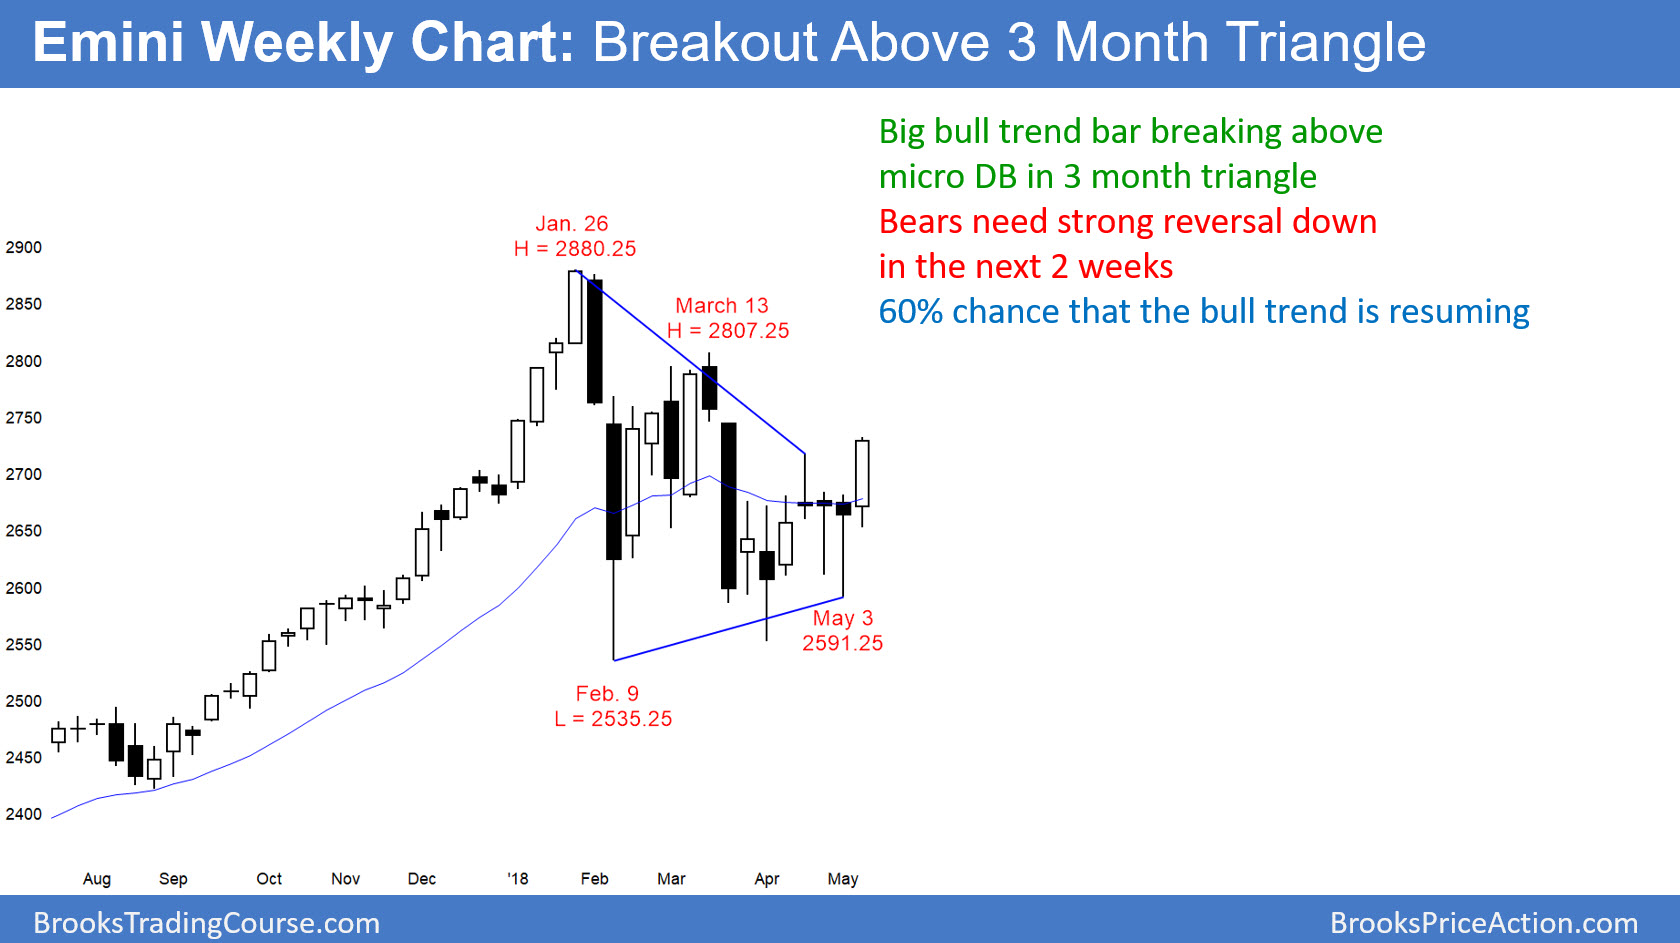
The weekly S&P 500 Emini futures candlestick chart is breaking above a six-week tight trading range. Furthermore, that range is nested within a three-month triangle. By going above the high two weeks ago, the Emini triggered a buy signal on the weekly chart.
The weekly S&P 500 Emini futures candlestick chart is breaking above a three-month triangle. Triangle breakouts, in general, fail 50% of the time. Since last year’s bull trend was especially strong, there is a 60% chance that this breakout will lead to a new all-time high.
But, traders need to see 2 – 3 consecutive bull trend bars before they will be confident that the breakout will succeed. If they get that, the rally will probably continue up to a new high this summer. If there are not strong follow-through bull bars, there will be a 50% chance that the four-month trading range will continue for several more months. Finally, if the next two-weeks are strong bear bars, the breakout will probably reverse down and the Emini will likely again test the February low.
Daily S&P 500 Emini futures candlestick chart:
Breakout above the April 18 major lower high
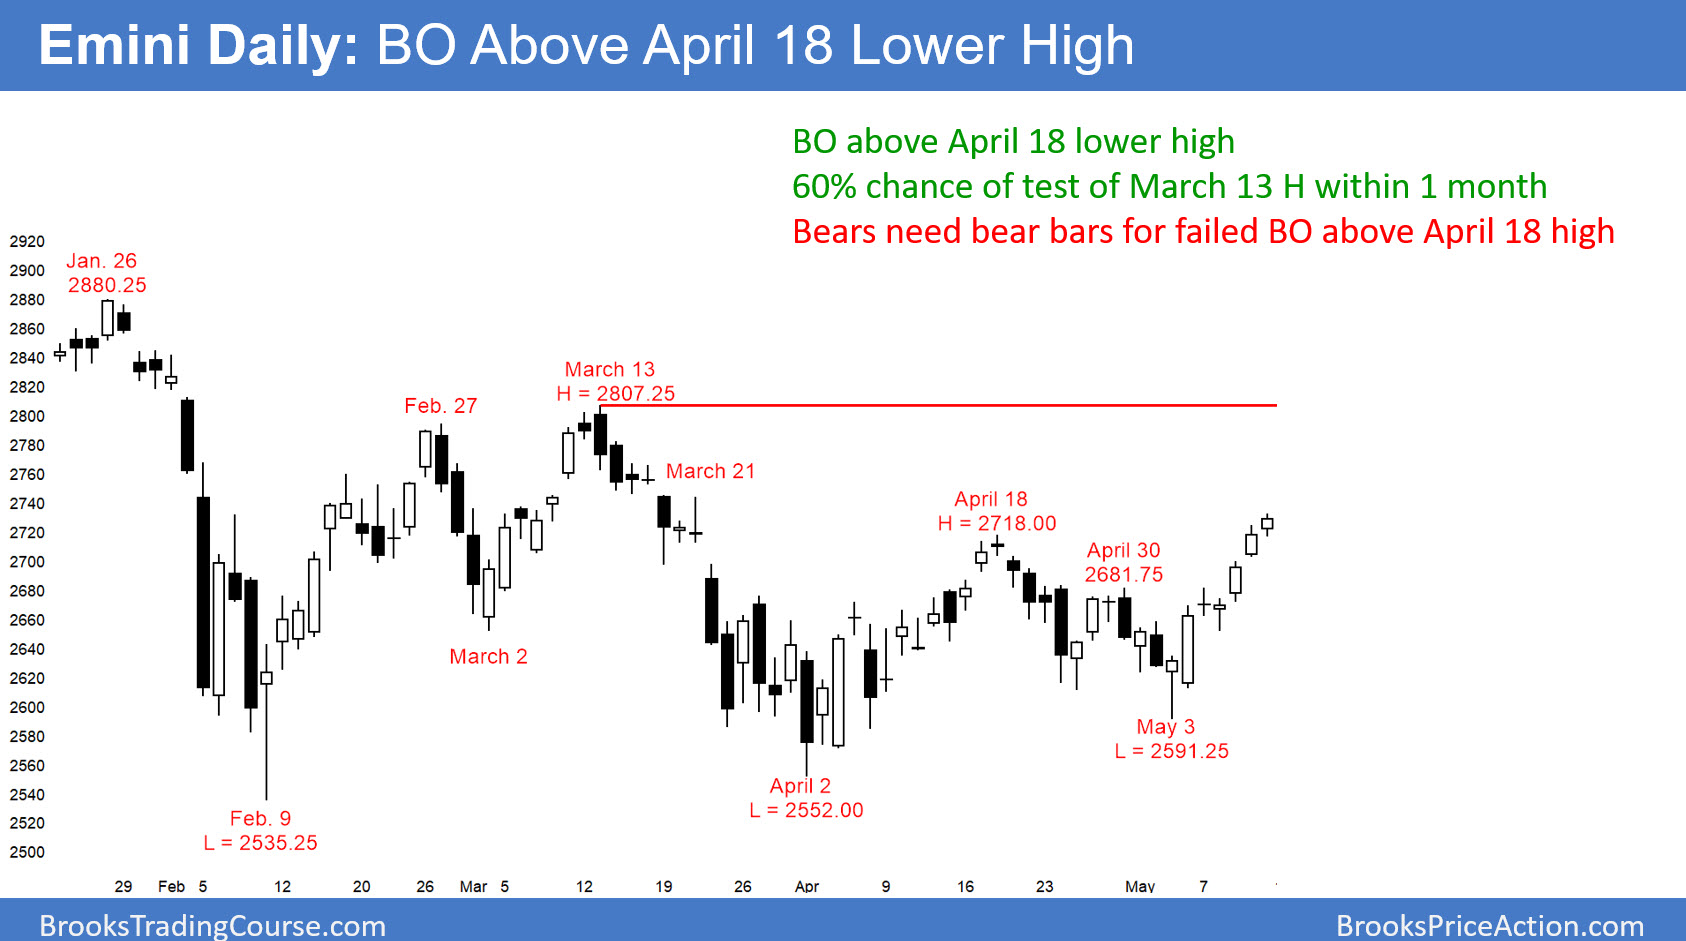
The daily S&P 500 Emini futures candlestick chart this week broke above the April 18 major lower high. However, the bulls need strong follow-through buying if the rally is to continue up to the more important March 13 lower high at 2807.25.
The daily S&P 500 Emini futures candlestick chart has rallied strongly from the May 3 low. In addition, last week (ending May 11) it broke above the April 18 lower high. It might stall here for a few days as it decides whether to continue up to the next resistance at the March 13 lower high or reverse down from a double top with the April 18 high.
The bears got a double top after the March 13 breakout above the February 27 lower high. The Emini then sold off for 250 points over the next few weeks.
What’s different this time? The rally up from the February 9 low followed a strong selloff. That made the rally likely to be minor. Therefore, the odds favored a test of the February low.
The current rally comes after two tests of the February low. Furthermore, the monthly chart was likely to begin to resume up within three months (see above).
onsequently, this rally has a 60% chance of successfully breaking above the April high and then testing the March 13 high at 2807.25.
In addition, even if it stalls there for a couple of weeks, the rally should break out to a new all-time high within 2 – 3 months.


