

I trade price action, not news. Therefore, I will wait for a breakout before switching from trading range trading to trend trading, writes Al Brooks Saturday.
Monthly S&P500 Emini futures candlestick chart:
Bulls need follow-through buying
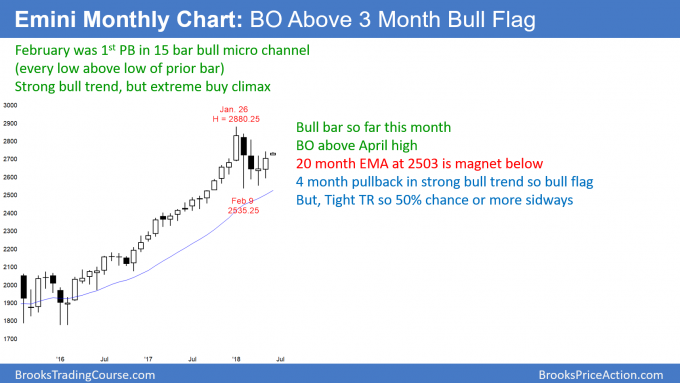
The monthly S&P 500 Emini futures candlestick chart had a bull bar in May, but a prominent tail on top. It was a breakout above a three- month bull flag.
The monthly S&P 500 Emini futures candlestick chart has been sideways for four months after a 15-month buy climax. While May traded above April’s high, it closed below that high. This is a sign that the bulls might not yet be strong enough to test the January all-time high. It increases the chances of the trading range lasting longer before the bull trend resumes.
Furthermore, the monthly chart has not touched its moving average in a long time. Any support is a magnet. The 20-month EMA is now just above 2500, which is just below the bottom of the four-month trading range.
Part of the reason for the lack of a strong bull breakout is that many bulls are beginning to wonder if the chart has to test this support zone. If enough of them do, there might not be enough buyers at the current price.
The Emini might have to drop to that support zone to find more buyers. If it does and then reverses up sharply, there will be a consensus that the bottom is in. That could lead to FOMO (Fear Of Missing Out) panic buying and a strong rally to a new high.
Only 20% chance of bear trend on monthly chart in 2018
There is still an 80% chance that the first pullback in a 15-month bull micro channel will test the high before the bears can get a bear trend. The odds go up for the bears if they can make the trading range last 10 or more bars. Alternatively, if they can create consecutive very big bear trend bars, they then would have a 50% chance of at least a 20% correction.
Weekly S&P500 Emini futures candlestick chart:
three-week bull flag after breakout of three-month triangle
The weekly S&P 500 Emini futures candlestick chart broke above a three-month triangle three weeks ago. The past three weeks are more likely forming a bull flag than a failed breakout.
The weekly S&P 500 Emini futures candlestick chart has had small bodies with prominent tails for the three weeks after breaking above a three-month triangle. This lack of immediate follow-through buying is a sign that the bulls are not yet strongly in control. But, there is still a 60% chance that these three weeks are forming a bull flag.
However, if the bears can create consecutive big bear bars, they could make the bull breakout fail. That would lead to another test of the bottom of the four-month trading range.
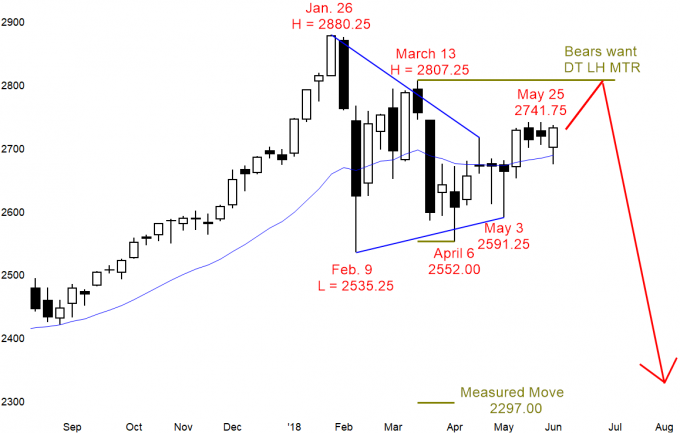
Possible double top lower high major trend reversal at 2800
There is no significant resistance above last week’s high until around 2800. That is a Big Round Number and just below the March 13 high. Because there is no resistance below that, the Emini could quickly get vacuumed up there. However, if it turns down at that point, it will form a double top with the March 13 low.
That would be an adequate test of the all-time high of 2880.25. Therefore, a selloff from there would have a 40% chance of a major reversal.
A major reversal in a bull trend is a bear trend. The neck line of the double top is the April 6 low of 2552.00. A measured move down from there is 2297, which would also be below the 20-month EMA. Furthermore, it would be a 20% correction.
While the weekly and daily charts would be in bear trends, the double top on the monthly chart would be too small to be major. Consequently, the 20% selloff would still be minor. That means that it would form a bull flag and not a bear trend.
Daily S&P 500 Emini futures candlestick chart:
Emini breakout soon after euro sell climax and treasury bond reversal
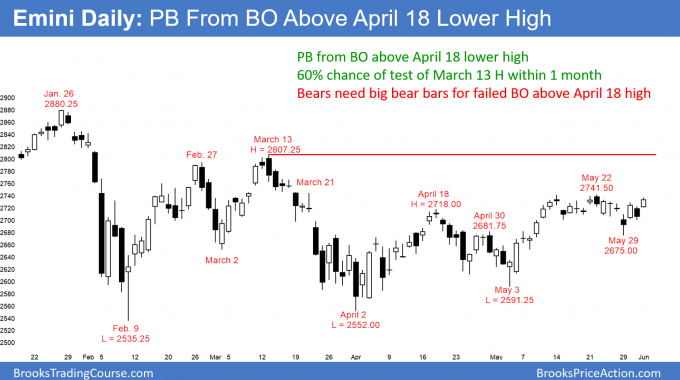
The daily S&P 500 Emini futures candlestick chart has been in a tight trading range for three weeks. There is a 60% chance that there will be a bull breakout above this bull flag.
The daily S&P 500 Emini futures candlestick chart has been sideways for four months. The May rally is strong enough to make at least slightly higher prices likely in June. But, legs in trading ranges are more likely to reverse than to lead to a successful breakout of the range. Therefore, as strongly bullish as the monthly chart is, the daily chart will continue to have 5 – 10 bar legs that reverse until it breaks out of the four-month range.
In addition, whenever the bulls have a strong rally, like they did in early May, there is always at least a 40% chance of an eventual successful breakout below the four-month trading range.
Bears want 350-point Leg 1 = Leg 2 measured move down to 2400
The bears want at least one more leg down after February’s strong selloff. Their minimum target is a Leg 1 = Leg 2 measured move. The first leg down ended with the February 9 low. It is therefore about 350 points tall. If May 22 turns out to be the start of a second leg down, the target would then be around 2400.
The bears see the trading range as a wedge bear flag after the February strong first leg down. The first leg up in the wedge bear flag is the March 27 high. April 18 was the second top. May 22 was the final top. They know that the past three weeks are forming a bull flag. But they also know that there is a 40% chance of a bear breakout below a bull flag. If they can get that breakout and make it strong, there would be a 50% chance of a test of the bottom of the wedge. That is at either the April or May lows.
Do Treasury bonds and the dollar matter?
No, not if you are a trader. A trader trades the chart in front of him and does not worry about anything else. He knows that the institutions instantaneously price in all information, and there is nothing that he can know that is not already priced in. You always see traders on TV trying to impress viewers with their profound analysis of fundamentals. It is simply hubris and it makes them look dumb.
Yet, the bonds rallied strongly for the past couple of weeks. In addition, the euro (EUR) is at the end of a sell climax. All financial markets are related. These two are changing their behavior. That increases the chance of a breakout in the stock market. But only an arrogant fool will confidently predict the direction of the breakout based on his analysis of the news and other markets. The odds favor a new all-time high in the Emini before there is a bear trend. However, there is still a 40% chance of a bear breakout first.
I trade price action, not news. Therefore, I will wait for a breakout before switching from trading range trading to trend trading.
I like the news. It is entertaining, and I like to know what is going on. However, I ignore it when placing trades. I wait to find out if more dollars see it as bullish or bearish and then trade.


