

My 80% rule says that 80% of breakout attempts in a trading range will fail. Consequently, it is better to look for reversals than breakouts. Read more for the second half of my rule, writes Al Brooks Saturday.
Monthly S&P 500 Emini futures candlestick chart:
Lower high and doji bar in bull flag
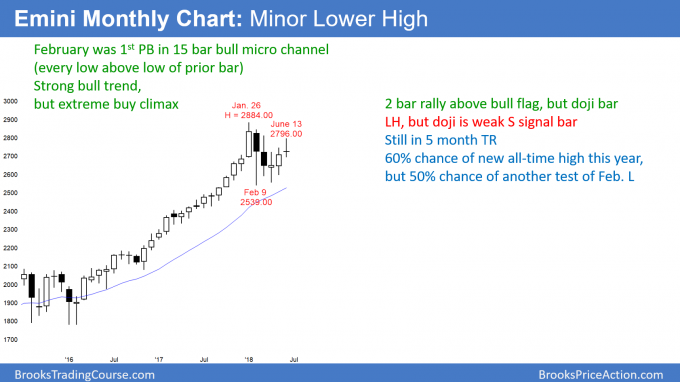
The monthly S&P 500 Emini futures candlestick chart in June was a doji bar. It is therefore a neutral bar and a low probability sell signal bar for July. The bull flag now has five bars.
The monthly S&P 500 Emini futures candlestick chart has been forming a bull flag for five months after a buy climax in a strong bull trend. The bulls hoped that the past three months was a resumption of the bull trend. However, April was a doji and therefore a weak buy signal bar. While May was a bull bar, it had a tail on top and it did not close above April’s high. Finally, June was a doji, which is weak follow-through buying. Hence, the three-month reversal looks more like a bull leg in a small trading range than a resumption of a bull trend.
Since June closed near its open, it is a neutral bar. Because it closed below its midpoint, it is a sell signal bar for July. However, a doji bar is a low probability sell signal, especially in a strong bull trend.
But, the 15-month buy climax on the monthly chart was the most extreme in the 100-year history of the stock market. Therefore, the pullback could last several more bars. For example, the monthly chart has been above its 20-month EMA for over 2 years. Since this is an unusually long time, June might be the start of a 2nd leg down to test the 20-month EMA. If so, the bull flag could continue for several more months.
Weekly S&P 500 Emini futures candlestick chart:
Weak selloff from wedge rally and double top
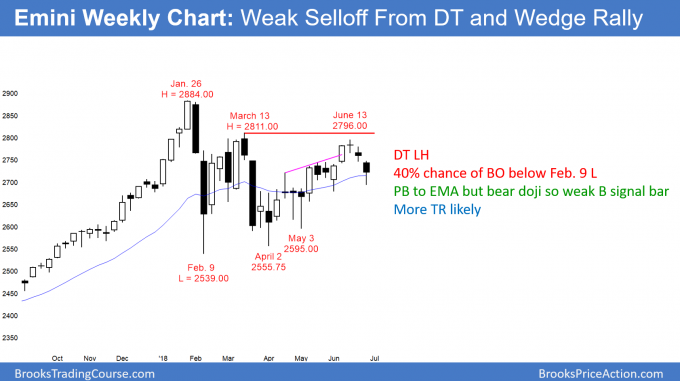
The weekly S&P 500 Emini futures candlestick chart formed a double top three weeks ago with the March lower high. In addition, the rally since April had three legs up and is therefore a wedge. However, the reversal down so far has been weak. This week was a bear bar this week, but it closed far above its low. Also, the three-week selloff does not yet have consecutive big bear bars closing near their lows.
January ended the most extreme buy climax on the weekly chart in the 100-year history of the stock market. Since the pullback on the weekly S&P 500 Emini futures candlestick chart has lasted about 20 weeks, it is more accurate to refer to it as a trading range instead of a bull flag. Once a pullback lasts 20 or more bars, the chart has become close to neutral. While the odds ultimately favor a rally to a new all-time high, there is now a 40% chance of a bear break below the trading range before a new high.
Trading range always means both a bull and bear trend
When the Emini is in a trading range in a bull trend, it is always also in a bull trend and a bear trend. The past two weeks sold off from a wedge rally to a double top with the March high. This is therefore the early stage of a bear trend. If the selloff continues down for a 300-point measured move below the neck line of the double top, traders will say that the bear trend began in January or with the May lower high.
On the other hand, if the Emini fails to break below the five-month trading range before making a new high, the bulls will say that the bull trend resumed with the April low test of the February low.
Trading ranges have at least two legs up and two legs down. They often have many more. Since markets have inertia, the resist change. Therefore, most breakout attempts fail and reverse, and the trading range continues to add more bars. One of my many rules is that there is no breakout until there is a breakout. A successful breakout usually has at least two consecutive big trend bars closing beyond the range. Anything less is more likely to reverse than to grow into a trend.
Daily S&P 500 Emini futures candlestick chart:
Emini bear leg in trading range after weak June wedge top
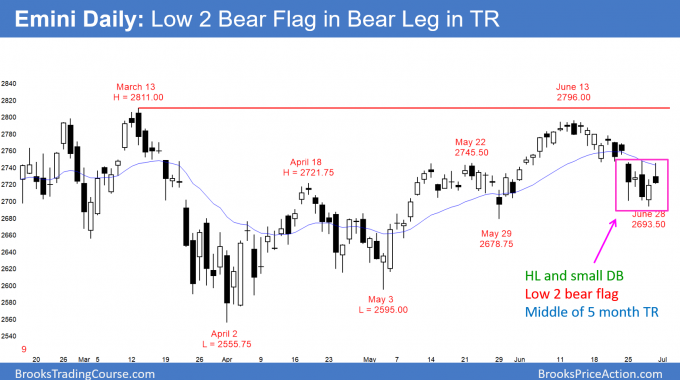
The daily S&P 500 Emini futures candlestick chart formed a micro double bottom this week in a three-month broad bull channel. Today created a Low 2 bear flag (a micro double top) just below the 20-week EMA.
The daily S&P 500 Emini futures candlestick chart has been in a trading range for five months. This week had a small reversal up from a four-day double bottom. But Friday was the entry bar for the bulls and it was a bear reversal bar. Hence, Friday became a Low 2 sell signal bar for this week.
The bear flag is below the EMA and in a bear leg. Therefore, the odds are that Monday will trade below Friday’s low and trigger the sell signal. There is also the magnet at the May 29 higher low. The odds are that the Emini will trade below that low within a couple of weeks.
However, the daily chart is a trading range and not a bear trend. Consequently, there will probably be more buyers than sellers not far below the May 29 low. That will probably limit the selloff from below Friday’s small bear flag to just a few days. There will likely be a reversal up from below May 29 low. The bulls will then have a 2 – 3 week rally. There is no sign yet that the five-month trading range is about to end.
80% Rule and market inertia
The bulls want a break above the March and May double top. However, a wedge top usually has a second leg down. Therefore, it is more likely that any rally over the next couple of weeks will turn down from a lower high. The bears will see that as a lower high major trend reversal. However, the reversal down will probably be minor and lead to more trading range, not a bear trend.
Trading ranges are constantly forming tops and bottoms. My 80% rule says that 80% of breakout attempts in a trading range will fail. Consequently, it is better to look for reversals than breakouts. When there is a clear, strong breakout above or below the range, traders will once again be willing to hold onto positions for more than a few weeks.
The second half of my 80% rule is that trends also have inertia. That means that 80% of trend reversal attempts will fail. It is therefore better to expect reversal to fail and for the trend to resume.


