

In part 1 of our commentary, we discussed the current Fundamental Gravity of our “Slowing Dragon” macro theme. If you missed part 1, I would encourage you to read that first, before jumping into part 2 here, writes Landon Whaley Friday. He explains market cycles here.
We covered a great deal of critical fundamental developments, which are bearishly impacting German equities and the US-listed ETF, iShares China Large Cap ETF (FXI).
Quantitative Gravity says what?
As a quick reminder, the Quantitative Gravity component of our Gravitational Framework is not technical analysis, which is ineffective and misleading. Rather, we use quantitative measures based on the reality that financial markets are a nonlinear, chaotic system.
We’ve identified four primary quantitative dimensions of financial markets that affect price movement: energy (trend), force (momentum), rate of force (buying pressure), and a market’s irregularity (level of imminent drawdown risk).
Social is our measure of a market’s current energy (or trend). FXI’s Social reading indicates it is asleep despite its most recent two-week, +9.5% bounce. Given the Fundamental Gravity, the most likely trend for FXI when it awakes is to continue its 2018 bearish hangover.
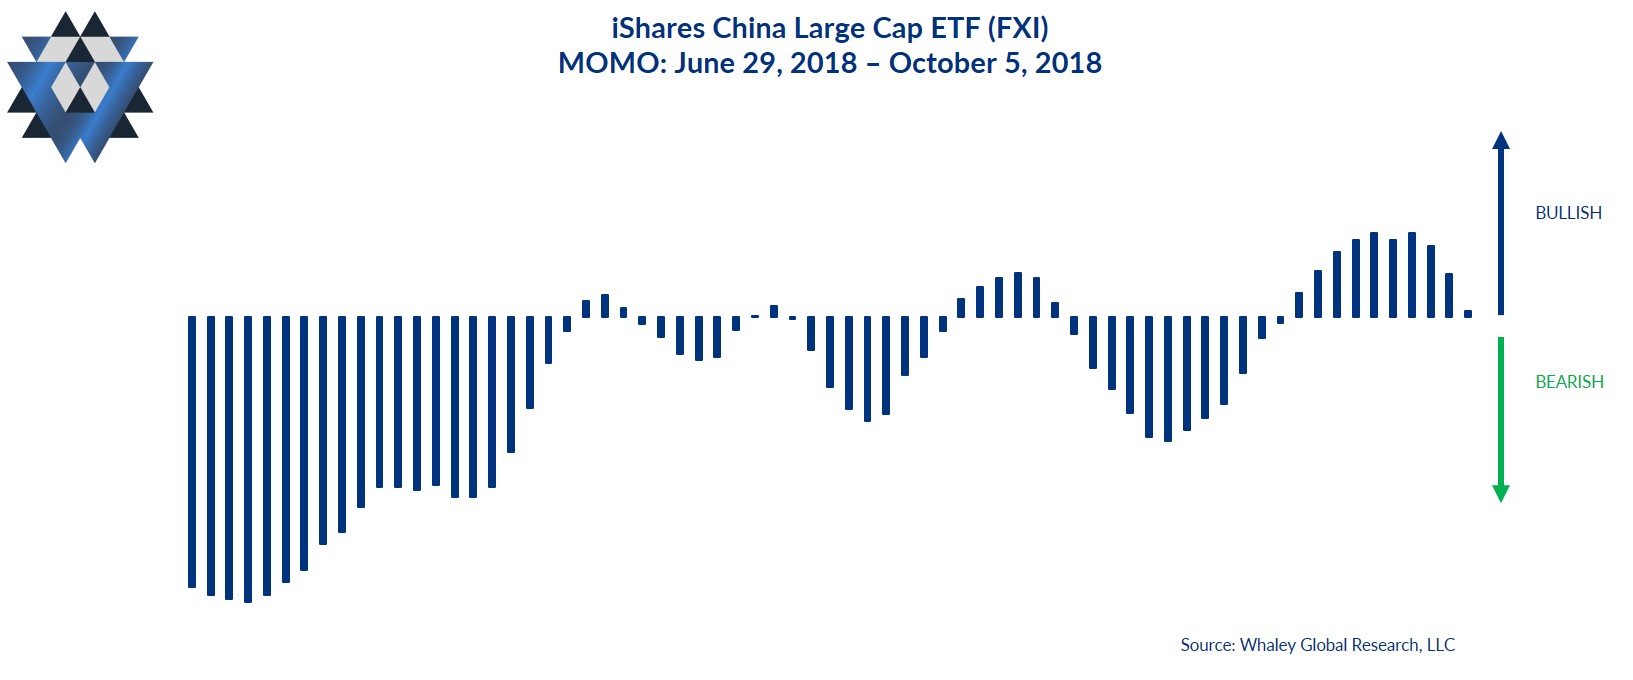
Momo is our measure of the amount of force behind the market’s current state. FXI’s Momo has been benignly bullish for 10 trading days, but it’s losing steam and is solidly in “neutral” territory. This is exactly the type of Momo reading we expect to see when bear markets experience conviction-less countertrend rallies.
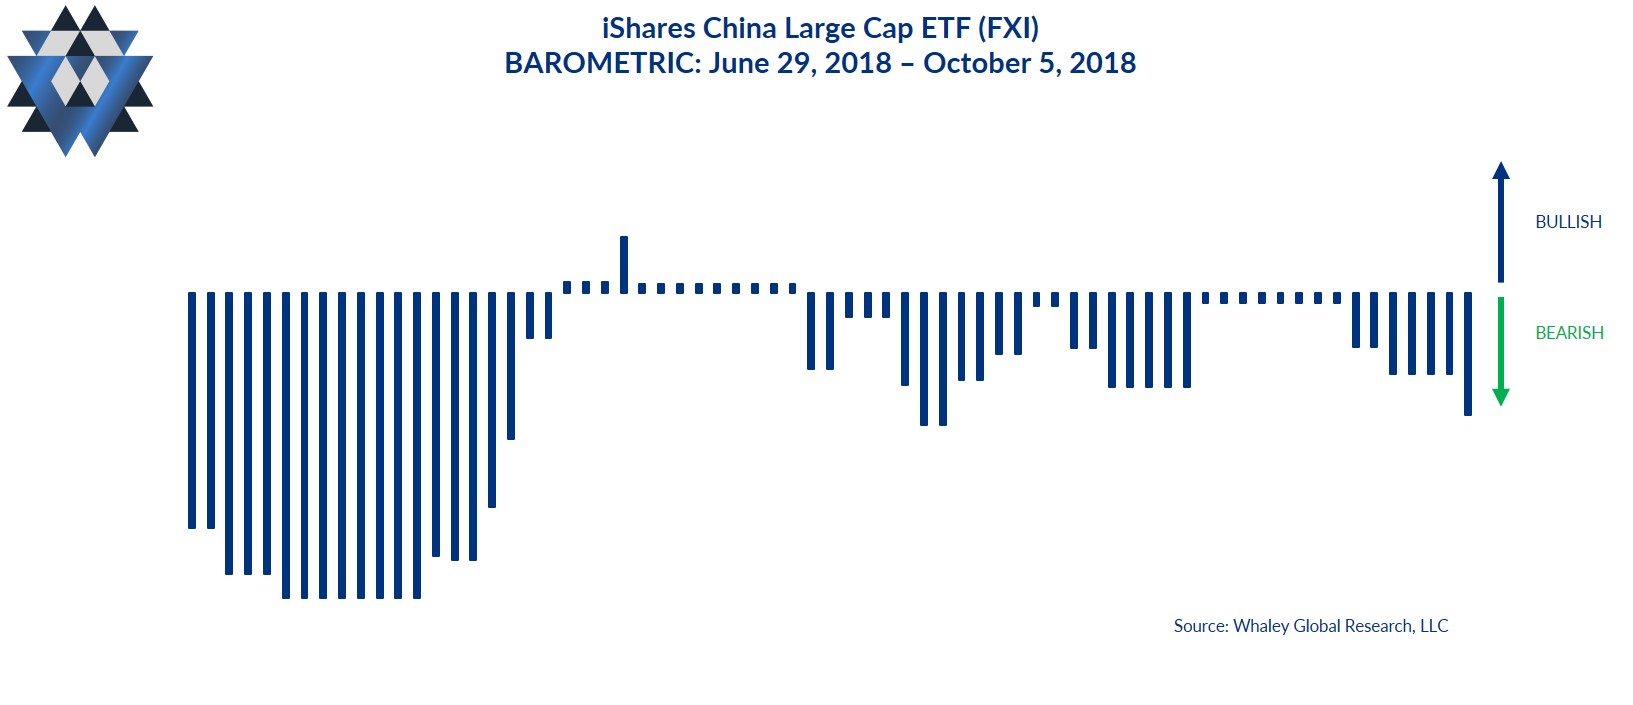
Barometric is our measure of buying and selling pressure or the rate of force behind the current Momo. Sellers have been in control of this market since early February and only relinquished that control for a brief time in early June. FXI’s current Barometric reading indicates sellers are firmly in control since taking it back from the bulls on June 15.
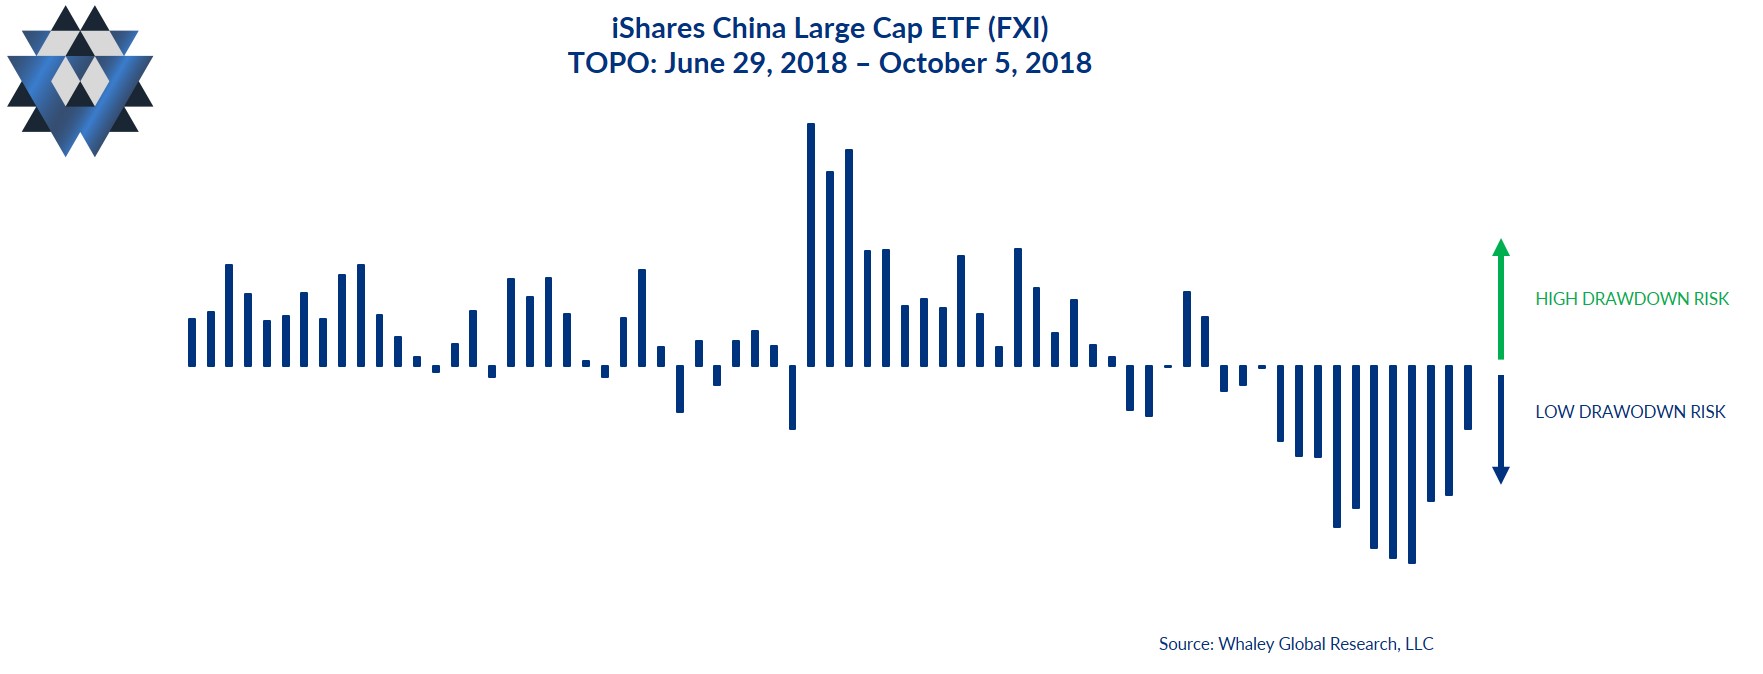
Topo, which measures the probability of a drawdown, is indicating a rising level of drawdown risk for FXI over the next 10 trading days. For the better part of the last month Topo has been declining, indicating a reduced risk of a drawdown. Last week’s rising Topo readings following year-to-date lows is an extremely bearish development.
Alpine and Abyss Lines
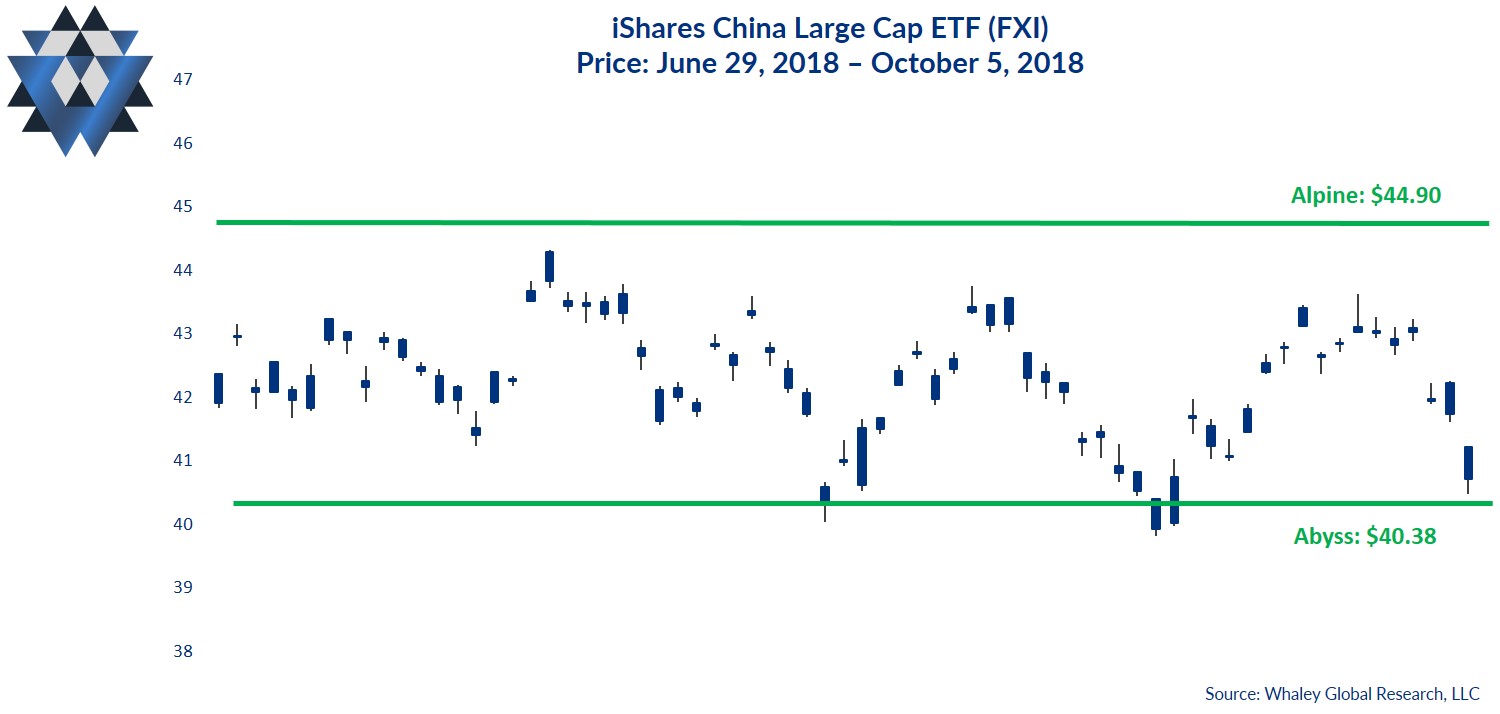
Our proprietary Alpine and Abyss lines are not “support” and “resistance.” Rather, they are the areas (calculated using fractal geometry and Chaos theory) above and below the most recent closing price where price is likely to experience an acceleration in its current trajectory, or a possible reversal of its current course. When a particular market’s price interacts with the Alpine or Abyss areas, regardless of whether the price is rejected by the Alpine or Abyss area or is able to breakout above (or breakdown below) it, the outcome gives you critical insight into the most likely direction of that market.
The most critical Alpine area for FXI above Friday’s closing price is between $44.90 and $45.47. This means that it’s highly likely that any upside price momentum will stall at this area. However, if FXI closes decisively above that area, price is likely to accelerate higher from there.
The most critical Abyss area for FXI below Friday’s closing price is between $40.38 and $39.73. This means that it’s highly likely that any downside price momentum will stall at this area. However, if FXI closes decisively below that area, price is likely to accelerate lower from there.
The Quantitative Gravity bottom line is that with Social, Momo and Barometric giving bearish readings alongside a rising Topo, not only is FXI’s bearish formation intact, but the most recent dead cat bounce is over.
Behavioral Gravity says what?
Behavioral Gravity allows us to evaluate investors’ perception of this market and how that perception changes and shifts over time.
The Behavioral Gravity Index (BGI) for FXI has been bullish most of the year, despite the bearish Fundamental Gravity and the -11.4% year-to-date return. The BGI is backed up by investor behavior as they’ve added an additional $1.4B to FXI since the beginning of the year. More importantly, $1.3B of those funds came after the January 26 peak, which means investors jumped on the FXI bandwagon after it rallied 16.9% to start the year. What they’ve received for their humanness in chasing markets is a ride to crash mode, as FXI is down -22.6% since that January peak.
The Behavioral bottom line is that investors chased FXI’s fantastic January performance by adding $1.3B to FXI and have been rewarded with a -22.6% crash. Strangely, the crash hasn’t deterred them; the BGI for this market remains in bullish territory and is providing us with a Gravitational divergence to trade.
The Trade Idea
As long as FXI trades below $45.04, new short trade ideas can be initiated opportunistically on rallies. Depending on your entry price and how much room you want to give this trade idea to move, use a risk price between $44.15 and $45.04. Your risk price line in the sand is $45.04. If FXI closes above that price, exit any open trades. If the trade moves in your favor and FXI trades down to the $40.38 area, consider closing some, or all, of your position.
We are currently out of FXI in our Asset Allocation Model and will send out an alert if we get the right entry price that skews the reward-to-risk characteristics of the short trade in our favor.
In addition to providing detailed analysis and trade ideas like this commentary on a weekly basis, we also provide real-time email alerts whenever we add, or close, a position in our Asset Allocation model inside our Gravitational Edge report.
Please click here and sign up if you’d like to receive an email alert when we initiate or close our position in this market and to participate in a an eight-week free trial of our research offering, which consists of three weekly reports: Gravitational Edge, The 358, and The Weekender.
Watch Landon Whaley discuss When Markets Cycle in a short video here.
Landon Whaley: We have a generation of investors and asset managers who know only one market. The reality is markets and economies cycle and catch people off guard.
Duration: 5:51.
Recorded: MoneyShow Dallas Oct. 5, 2018.


