

Traders always jump the gun on weak reports. To make money, you need to jump the gun before them. You also need a reasonable thesis to back up that bet. We aren’t at a point where you can start shorting the overall market because of this metric, says Don Kaufman.
Initial jobless claims were up 10,000 to 234,000 in the week of November 24. As you can see from the chart below, the 4-week average increased 4,750 to 223,500 which is the highest reading since July. It is still too early to say for sure that the bottom in claims is in but slowing overall economic growth makes it slightly concerning.
However, when you look at the non-seasonally adjusted data, the spike is lower than last year.
Reuters: US-China trade detente helps Wall Street build Monday on last week's gains.
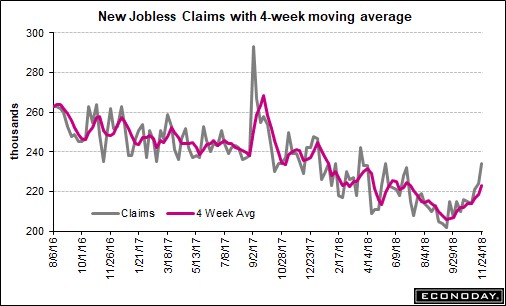
There aren’t one-time factors which made this jump happen. I will be following this report closely in the coming weeks. By the time they fully spike, stocks will already be lower.
Continuing claims from the week of November 17 were up 50,000 and the 2-week moving average was up 20,000 to 1.668 million. This is up from the 45-year low of 1.635 million in October.
The unemployment rate of insured workers increased 0.1% to 1.2%. We’re still near the record low in initial jobless claims in relation to the labor force, so don’t sell stocks based on this yet.
To be clear, there are reasons to bet against the market as the economy is seeing a cyclical slowdown; jobless claims just can’t be a part of your bearish thesis yet.
Leading index craters further
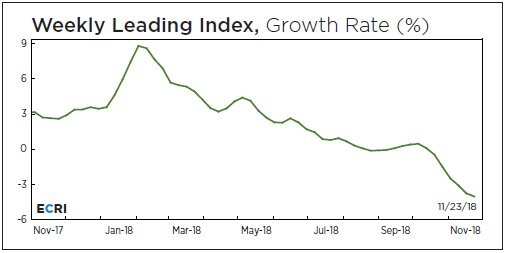
Speaking of reasons to go bearish, the ECRI chart below shows its leading index is down 4% year over year which is worse than the 3.7% decline the previous week. Furthermore, this is the lowest reading in 143 weeks. The deceleration in the index caused the low reading to jump from 141 weeks to 143 weeks.
To be clear, if the index declined slightly, it would have been a 142-week low, but this sharper decline pushed it below where it was 142 weeks ago.
Year over year growth probably will crater in the next 3 months because growth was so high in January. That’s why I think it’s important to also pay close attention to the lows it makes. The index can increase from where it is now, but still can have negative year over year growth in January because of the tough comparisons. Those are just some nuances, so you don’t misread the chart.
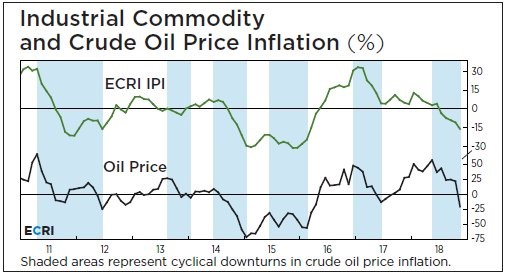
ECRI hasn’t only been correct in calling for this economic slowdown. It’s industrial production index correctly forecasted the decline in oil prices which you can see in the chart below.
This chart also shows the current relative weakness compared to the previous slowdowns. The deepest slowdown this cycle has undoubtedly been the one from late 2015 to early 2016 as it was almost a recession. As the green line shows, the index is down 15% year over year which is about half the decline in 2015 and 2016.
This doesn’t mean this slowdown will be shallower than the previous one. It’s still falling and shows no sign of stopping.
Earnings estimates coming down
Earnings are following economic momentum lower. Earnings growth was always expected to slow because the comparisons are getting tougher. However, this steep of a decline is problematic. It explains why multiples have contracted. Multiples expanded in 2017 because investors knew 2018 was going to be a solid year for the economy and earnings growth.
Earnings multiples are contracting now because investors are concerned with 2019. Now that multiples have contracted, investors need to determine how weak the economy will get next year.
As you can see from the table below, estimates for Q4 earnings have fallen from 15.37% growth on October 1 to 11.3% growth on November 30. If you are only concerned with the fact that earnings are growing strongly, you’re missing the point. 11.3% is great in a vacuum, but not great when expectations were higher.
The earnings growth in 2019, might not even be great in a vacuum. As you can see, the estimates for Q1 and Q2 growth have fallen to 6.26% and 5.46%. That wouldn’t be a disaster, but those aren’t the final estimates either. By the time firms report Q4 earnings, Q1 estimates might be in the low single digits.
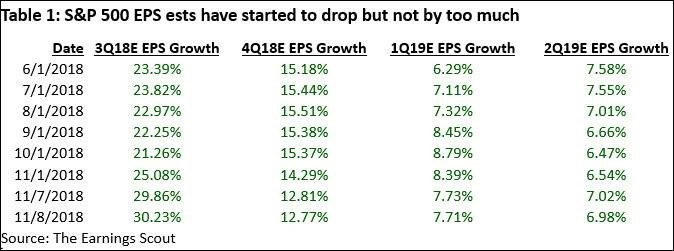
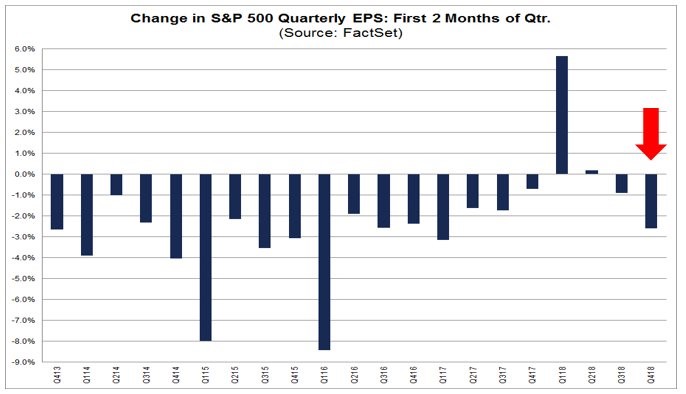
When you combine the chart below with the one above, you get a complete picture of earnings estimates. You need to know the recent changes in estimate growth and how they compare to prior quarters. As you can see, estimates usually decline, but they increased in Q1 and Q2. If the Q1 estimates in the first 2 months of the year decline the same as they did in the first 2 months of Q4, it won’t be a problem.
However, the issue is the declines have gotten worse for 3 straight quarters. If it gets worse next year, it will be a below average change.
When you consider the much lower estimates to start the year, it means growth will be close to flat. The only way stocks can rally when growth is flat is if multiples expand.
Once again, rate of change analysis implies growth will keep getting worse. Investors now need to decide if this will be a slowdown or a recession. If it’s just a slowdown, earnings may not fall much.
Conclusion
Economic growth is slowing. There’s no end in sight for this slowdown as the ECRI leading index keeps falling.
Q4 earnings estimates are falling sharply. If that continues, we may barely see any earnings growth in 2019. Jobless claims are spiking, but this could be noise. We’ll know if it isn’t noise in the next few weeks.
When the 4-week average gets above 250,000, it will be time to act by betting against the market. I’m not bullish now, but I don’t base my skepticism on the jobless claims.


