

State of the market: Although there are signs that the decline could end soon, don’t trust the market. Use sell stops to limit further potential losses, writes Dr. Marvin Appel Friday. He's presenting at TradersExpo New York March 12.
The S&P 500 Index (SPX) extended its decline, breaking below what had been support around 2635 (closing levels) and hitting its low for the year on Dec. 20. There are some indications that we could see a bounce. First, signs of panic seem to be developing, specifically a jump in the CBOE Volatility Index (VIX) to the highest level of the decline (circled in chart below) and increasing volume.
We have also seen capitulation in sectors that had been holding up relatively well during the decline such as Healthcare SPDR ETF (XLV) and Consumer Staples Select Sector ETF (XLP).
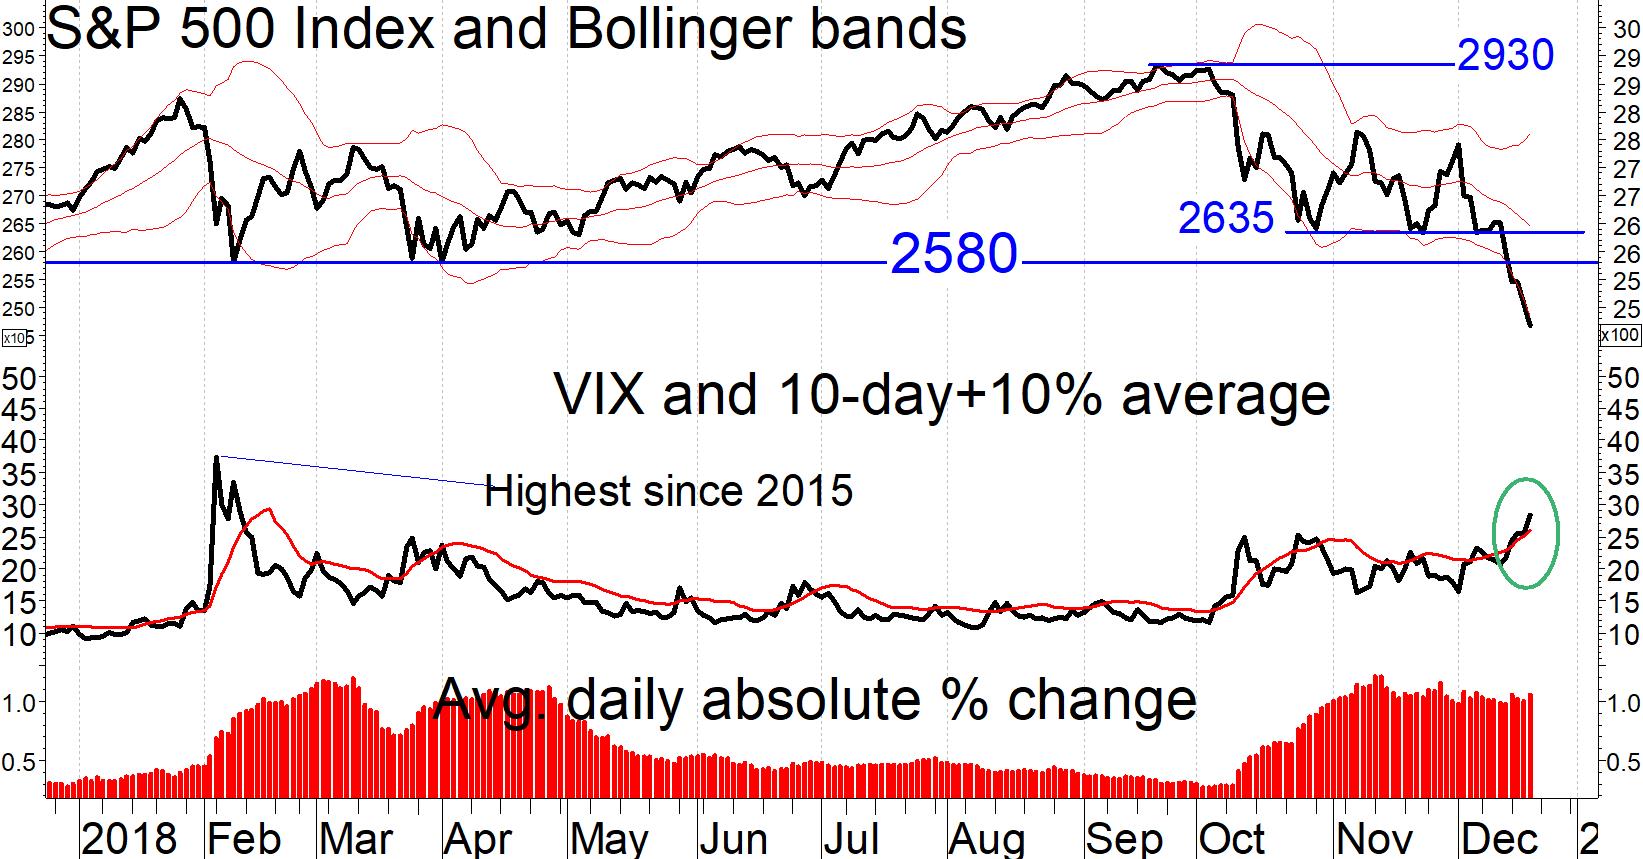
The decline in the S&P 500 Index from Dec. 3-19 was 11.6%, similar in magnitude to the 10% decline that occurred from Oct. 3-19, suggesting that 2467 (the most recent closing low) could be a support area for a few days.
From Sept. through early December the S&P 500 Index defined a 295-point wide trading range of 2635-2930. Since the lower end of that range has been violated, the next downside objective would be 2340 (295 points below 2635), some 5% below the Dec. 20 close.
However, I would not assume that the decline will stop at any of these projected levels. Monthly charts project an ultimate downside objective of 2130.
The drawdown the S&P 500 Index has already experienced is beyond the historical precedent of what has occurred when our model has been on a buy signal, so I recommend adopting a back-up risk management plan of using 241 (closing price of SPY) as a sell stop level.
The market could as easily fall another 10% as recover 10%. With current levels of extremely high volatility, we are making an orderly retreat from our clients’ equity exposure.
High yield bond update
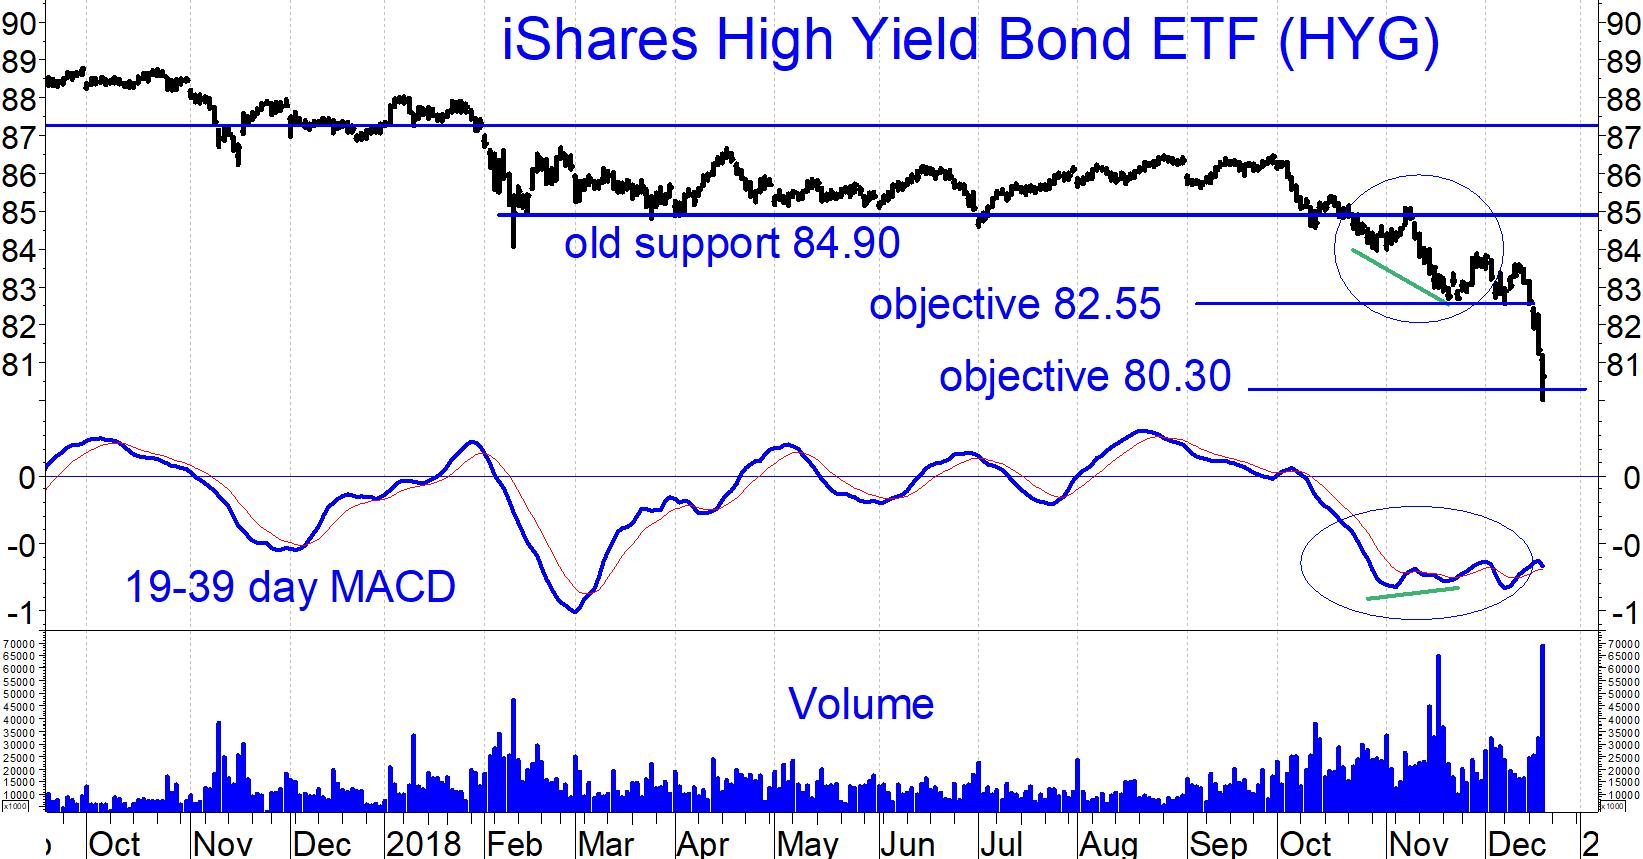
High yield bonds have broken down along with stocks. (See HYG chart below.) Moreover, the favorable-looking positive divergence between iShares iBoxx $High Yield Corporate Bond ETF (HYG) and its MACD in November has been annulled by the December MACD low (circled in chart).
As with the S&P 500 Index, HYG has fallen to a downside objective, but I do not recommend catching a falling knife. There will be plenty of time to re-enter high yield bonds, and with their yields the highest since 2016, the opportunities at the next fresh buy signal will be very attractive.
Emerging markets: Best house in a bad neighborhood
Stocks are risky now, but the next place to consider adding to equity exposure when conditions improve looks to be emerging markets.
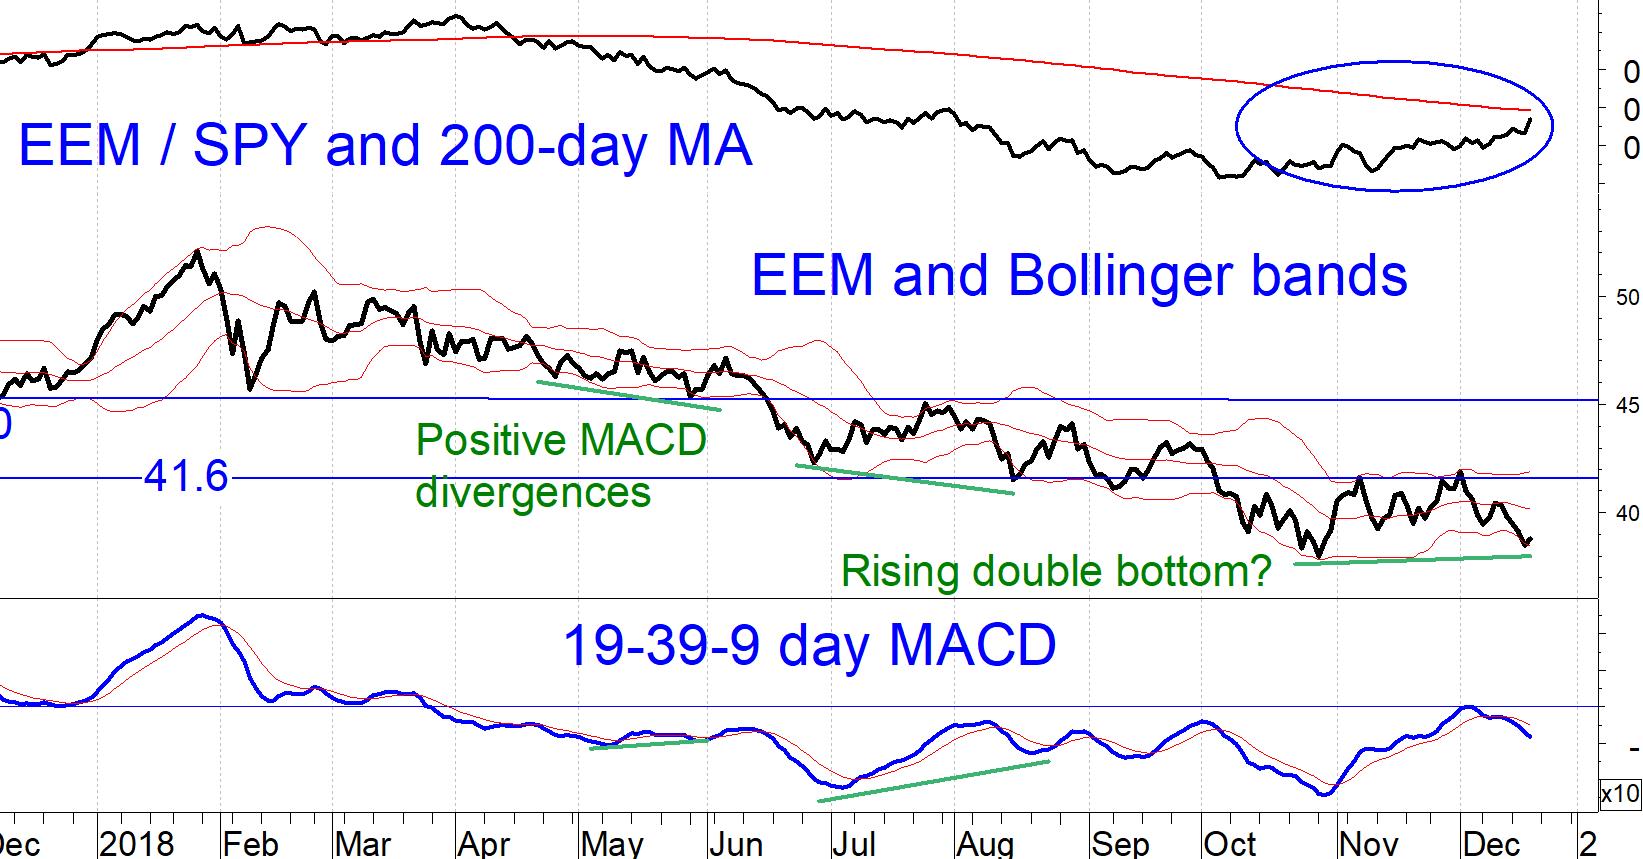
The top part (circled) in the chart below shows that the iShares MSCI Emerging Markets Index ETF (EEM) has been steadily outperforming SPY during the recent decline.
In fact, EEM did not make a new low on December 20, although it is too early to pronounce a bullish rising double bottom formation (see EEM chart).
I am baseline skeptical about having permanent allocations to non-U.S. stocks, but as a tactical strategy emerging markets look attractive.
The formal signal to expect EEM to outperform SPY is when the ratio EEM/SPY is above its 10-month simple moving average. The 200-day moving average in the EEM chart above shows that we are close to that signal.
—Marvin Appel
Sign up here for a free three-month subscription to Dr. Marvin Appel’s Systems and Forecasts newsletter, published every other week with hotline access to the most current commentary. No further obligation.
View Marvin Appel discussing MACD bond signals in a short video here.
Recorded: TradersExpo Las Vegas, Nov. 13, 2018.
Duration: 2:56.
View Marvin Appel discussing MACD buy signals for equities in a short video here.
Recorded: TradersExpo Las Vegas, Nov. 13, 2018.
Duration: 3:41.
View a video interview with Marvin Appel and Dan Gramza on 2018 investing opportunities here.
Recorded: July 25, 2018 at TradersExpo Chicago.
Duration: 6:30.
View a video interview with Marvin Appel and John Bollinger on Bollinger Bands, when they are most useful for traders and about systematic investing pioneered by Dr. Appel and his father Gerald Appel here.
Recorded: July 25, 2018 at TradersExpo Chicago.
Duration: 4:31.


