

If this market is really going to mirror the action in 1991, we could see this rally extend well into the spring before a meaningful pause, writes Joe Duarte, Editor Joe Duarte in the Money Options.
Last week I wrote: “this market is being compared to that of 1991, which happened to be a third year of a presidential cycle and where the U.S. partook in Gulf War I. During the first quarter of 1991, the S & P 500 (SPX) rose 16%, 11.26% in January alone.” In fact, in that hugely profitable year SPX rallied 28%.
So, if this market is really going to mirror the action in 1991, we could see this rally extend well into the month of March or April before we see a meaningful pause. Moreover, momentum indicators continue to support higher prices, although I expect any pullback will both be volatile and temporary as profit takers bail out and dip buyers step in.
The Song Remains the Same for Now
Led Zeppelin once noted “the song remains the same.” Indeed, the major factors pushing stocks higher are still the expectations of central banks easing monetary policy and the hopes for a major trade deal between the U.S. and China. But with the major indexes now closing in on their 2018 highs, it’s more likely than not that we will see some sort of pause in the rate of rise in this market.
The key is the character of the pause, whenever it develops. Of course, things could go in several directions, but two scenarios are most likely. First, and more likely, is one in which the major indexes top out near the 2018 highs and form a consolidation pattern centered around the 200-day moving average. If this scenario develops, it could last well into the summer. Furthermore, it’s important to consider the character of a sideways market. For one thing, even if the indexes are flat, there will be some stocks that continue to rise, even as others fall. Thus, stock and sector picking will be paramount in this type of market if it develops.
The second scenario would be one in which the market fully reverses and embarks on another 2018 Q4 like aggressive decline, which wipes out the recent gains and could develop into a major bear market.
It’s hard to figure which way things will break at the moment, but much depends on the success of the Trump talks with China and how central banks behave in the next few weeks.
Here are this week’s big picture bullets:
- Central banks are on the markets’ side
- The bond market is in synch with the Fed for now
- Headline risks persists: Think U.S.-China trade war, slowing economic data, geopolitics
- Look for swift corrections and price dip buying
- Think sector rotation: new leadership is emerging
- Short term volatility is here to stay
New Highs on New York Stock Exchange Advance Decline line
The mainstream media is now reporting on the New York Stock Exchange Advance Decline line new highs, which of course, makes me a bit leery since once the media starts touting an indicator it can lose its accuracy. Nevertheless, this highly reliable indicator since the presidential election of 2016 continues to forecast higher prices.
;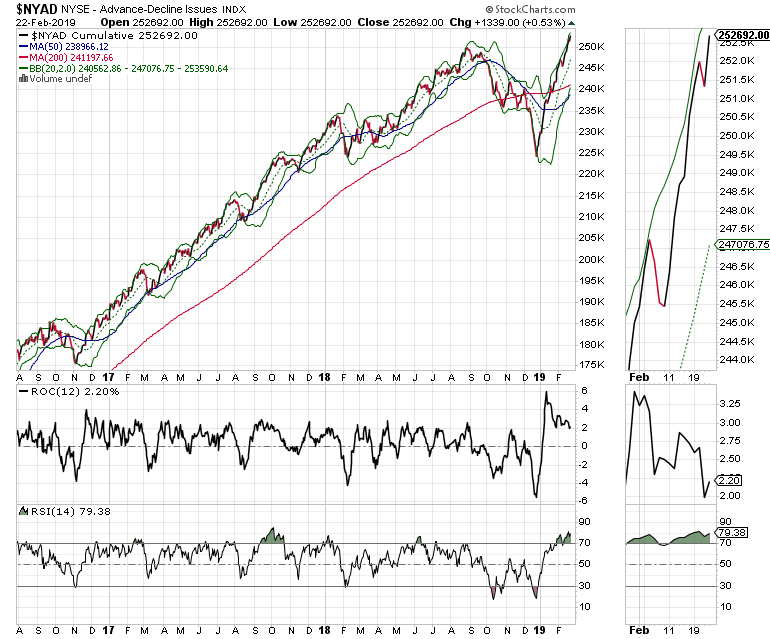
Beyond the line itself, though, it’s important to note that the Relative Strength Index (RSI) is overbought and that rate-of-change (ROC) is above the zero line (bullish) but not rising, which suggests that momentum is slower than it was a few weeks ago. This latter point is worth noting but not a problem unless ROC falls below the zero line, which would signal a faltering of momentum.
;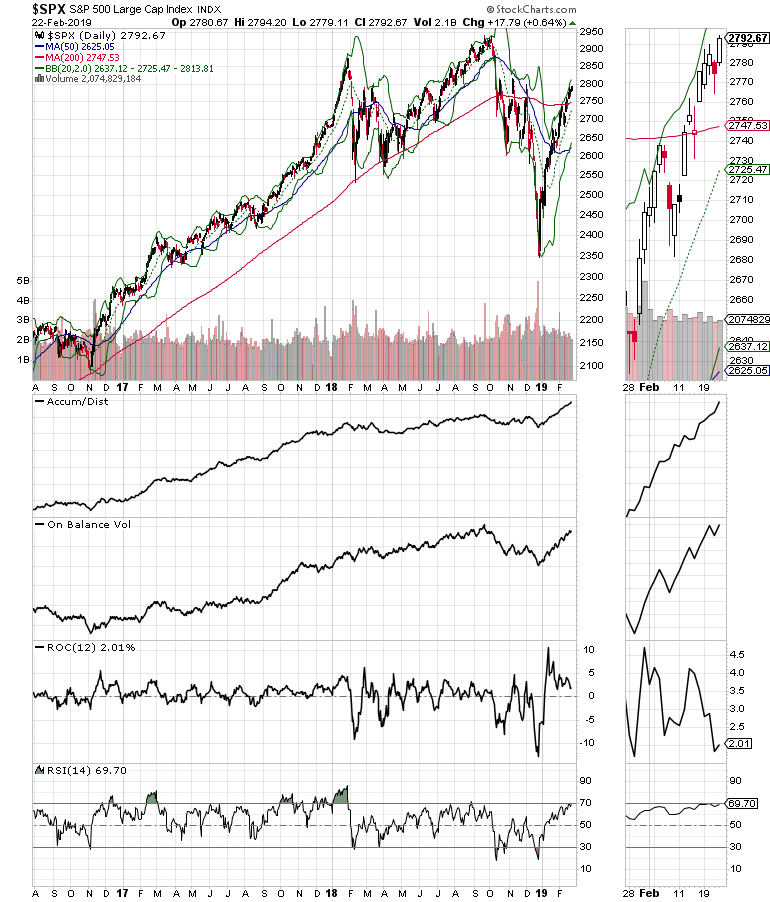
Both the S&P 500 (SPX) and the Nasdaq 100 (NDX) indexes are now above their 200-day moving averages, which marks a return to the long term up trend. Neither index is overbought based on RSI. And both are still showing positive Accumulation Distribution (ADI) and On Balance Volume.
;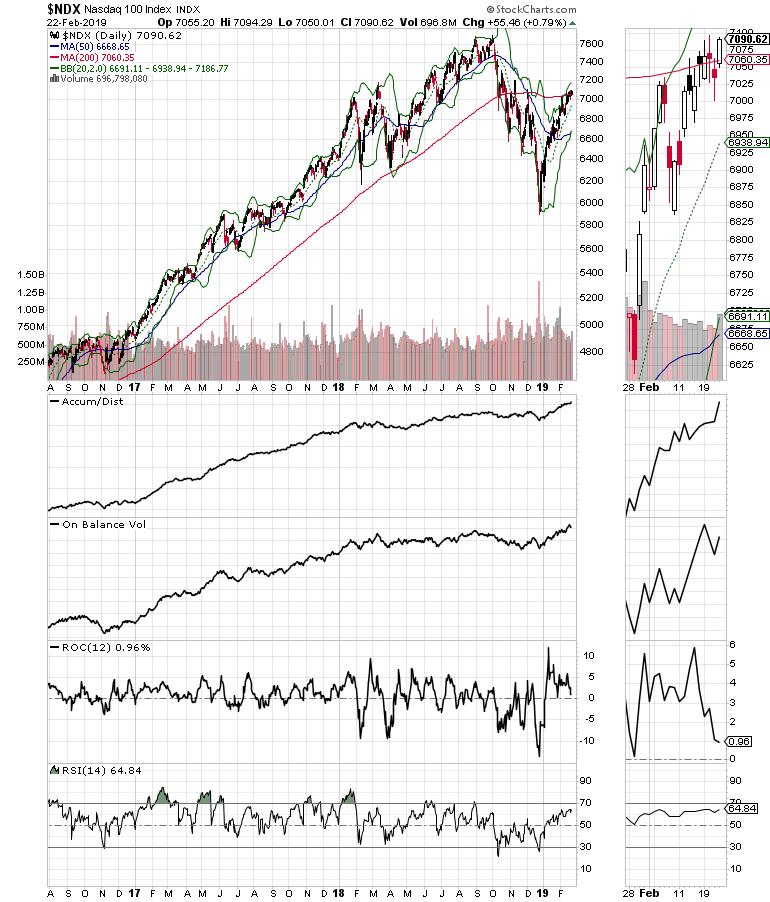
Putting the picture in stocks all together, and barring a major disaster in the next week or two, this market is likely to move back to the Q4 2018 highs before making a decision about what happens in April and beyond.
;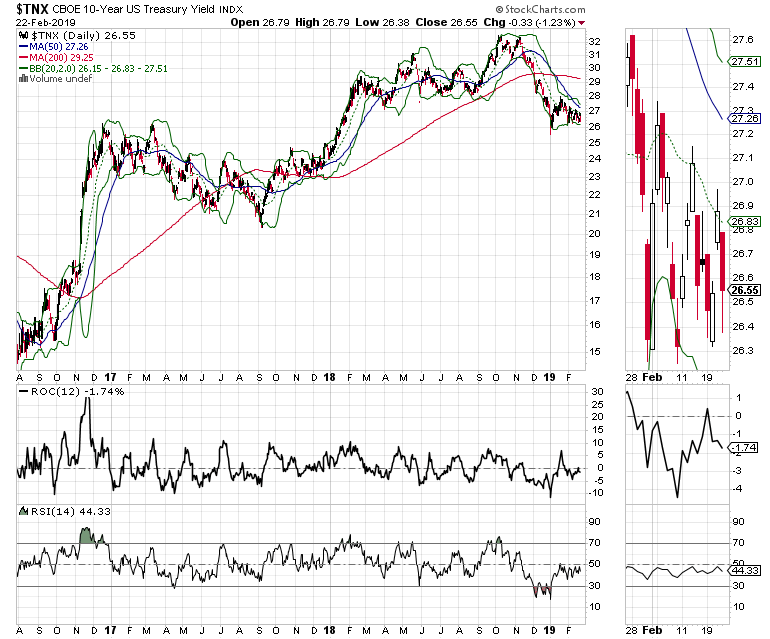
Finally, the bond market is getting in synch with the Fed. The U.S. ten-year Treasury note yield (TNX) is below its 200-day moving average, but has not broken to a new low in yield in the last two weeks. This has come despite slowing U.S. economic data, which suggest that the bond market is not sensing a full implosion of the economy, yet. The key yield point seems to be 2.5%. A break below that would signal that bonds are souring on the economy. If that happens, I would expect some weakness in the stock market.
Look for new Leadership
Many stocks are close to breaking out of long-term bases. There is also a broadening of the market beyond technology (XLK), with health care (DRG, BTK) acting well along with some homebuilding stocks (TOL). Expect swift and violent corrections and dip buyers coming in. These are all characteristics of a bull market where robotic algorithms rule the roost.
Therefore all we can do is trade day to day and let the price action guide decision making. Stick with what’s working, but also cast a wider net and take profits when your stocks seem to stall. Moreover, as valuations rise, it makes sense to use options for stocks that are overvalued and expensive, but are still in momentum fueled rallies.
More than anything, don’t get too comfortable. If U.S.-China trade talks implode, all bets are off.
I own shares in TOL as of this writing.
To receive Joe’s exclusive stock, option, and ETF recommendations, in your mailbox every week visit our website


