

The background for stocks remains positive over the intermediate term, although short term volatility remains likely, writes Joe Duarte.
The background for stocks remains positive over the intermediate term, although short term volatility remains likely.
Overall, momentum in the stock market remains to the up side. This is because the Chinese economy may be bottoming out as the global economy continues to slow and the U.S. growth rate is moderating. This combination of factors suggests that global central banks are not likely to raise interest rates in the foreseeable future, while the People’s Bank of China continues to ease monetary policy.
Nevertheless, even as patience is a virtue, stock picking is more than ever an art. Thus, in an algorithm dominated, headline driven market, it can be difficult to pick winners, which is why using options for high priced stocks whose charts look attractive may be a very viable and profitable alternative.
Therefore, this is a market where momentum and the daily headlines rule the roost. That means that stocks with high valuations and equally high share prices are moving rapidly if there is momentum buying in the shares. This is partially due to their presence and heavy weighting in the major indexes. But it is also due to the fact that robot traders gravitate toward momentum stocks with high liquidity, especially the stocks of big companies with billions of dollars in stock buyback programs. Moreover, if that’s where the action is, that’s where traders need to be.
Here is an example of how to use this strategy. Shares of Home Depot (HD) were trading near $200 per share. Arguably, for risk averse traders, especially those with accounts of less than $100,000, owning even 100 shares of a stock with that high a share price can tilt a portfolio’s asset allocation and raise risks of big losses for the total portfolio if the trade goes the wrong way.
Accordingly, this is precisely where options can help. Home Depot May 17, 2019 $200 calls were recently selling near $3 per contract. We opened the trade on April 1 and closed it on April 5 with roughly a 170% profit in five days. Thus, roughly a $300 investment delivered more than $600 in profit. In comparison, owning 100 shares of HD would entail a $20,000 investment. If the stock goes up, you do well. But if the stock falls precipitously the losses could mount rapidly. A worst case scenario option trade in this case would have capped the loss at around $300.
This trade is a clear illustration of how options can be useful in this type of market.
This week’s bullets
- Calendar: U.S. CPI, University of Michigan Consumer Confidence data along with housing and mortgage data headline the week along with the release of the most recent FOMC minutes.
- Big Picture: The third year of the Presidential Cycle (2019) is traditionally bullish for stocks. Watch the bond market, oil prices, and the U.S. border dispute. Keep a very close eye on U.S. China trade talks and the ongoing reserve ratio manipulations in China.
- Risk: Headline risk remains.
- Market Behavior: The trend is heating up. Volatility will remain. Algos are buying on dips and hedge funds are piling on as stock buybacks surge. Meanwhile the market is heading to “overbought” territory. Watch for short term reversal and how traders react.
- What to do: Stay patient. Expect volatility. Hedge when it’s called for but not excessively. Manage positions individually. Give stocks more room to maneuver by widening sell stops but sell if your stops get hit. Use options for high priced stocks.
Momentum is Rising
The New York Stock Exchange Advance Decline line (NYAD) remains the most accurate indicator of the market’s trend since the 2016 presidential election. And this week, it made another new high again predicting higher prices ahead.
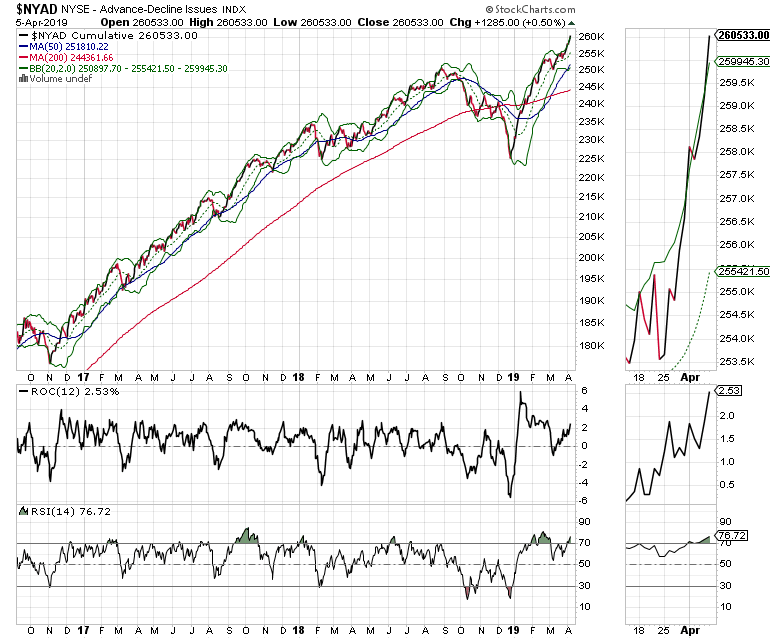
Certainly, NYAD is becoming a bit overbought given the rise of its relative strength index (RSI) indicator above 70 and the line’s recent excursions above its upper Bollinger Band, at least on an intraday basis. Usually, this means we can expect some sort of pullback in the line, perhaps to its 20-day moving average.
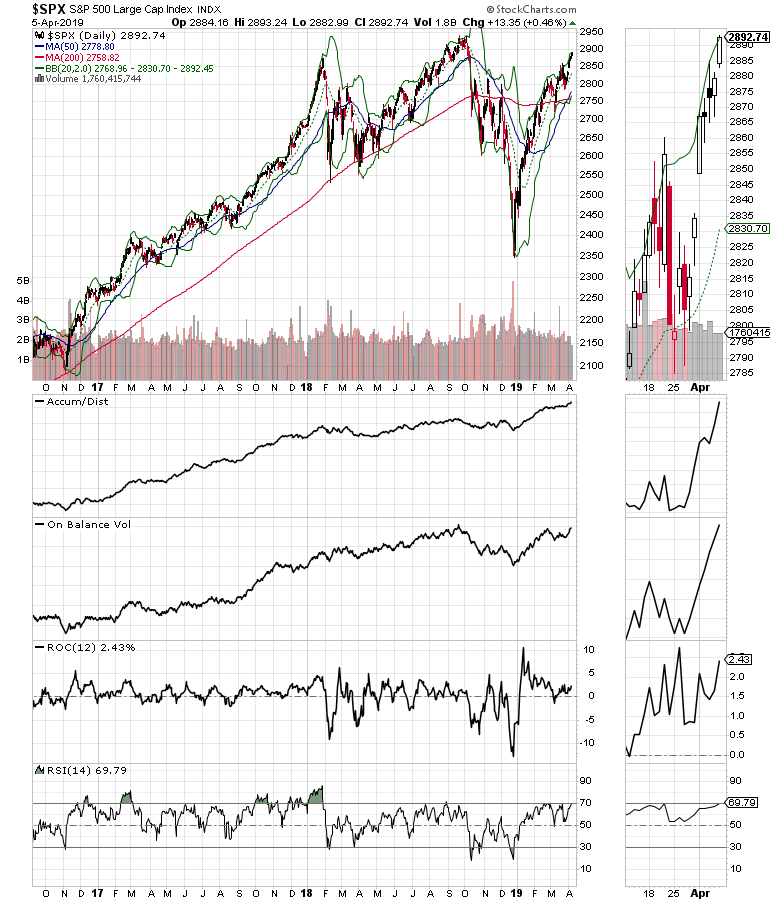
Meanwhile, the S & P 500 (SPX) and the Nasdaq 100 (NDX) indexes are both moving toward a test of their 2018 highs, which could trigger some selling in the short term.
Specifically, SPX is starting to look a bit overheated. As is evident in NYAD, SPX is also testing the resistance of its upper Bollinger Band, and thus could pull back in the short term. However, Accumulation Distribution (ADI) and On Balance Volume (OBV) are both very encouraging, which is usually a sign that any pullback is likely to be relatively short in duration, especially with traders who have missed the rally buying the dips and the algos following.
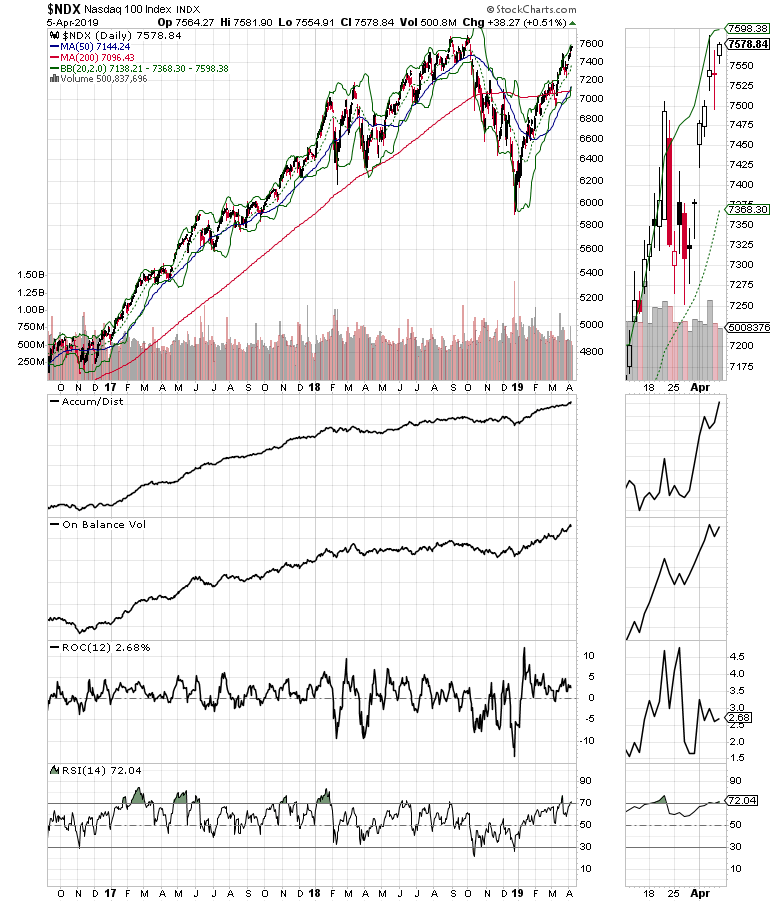
NDX is displaying a similar picture to SPX. However, with momentum returning to stocks such as Micron Technology (MU) and Texas Instruments (TXN), NDX seems to have the potential to pull off higher prices and perhaps even deliver a breakout to new highs before the summer.
Stick with what Works
This market calls for patience, accurate stock picking, and the prudent use of options. Thus, traders who can adapt their game to the current algo-influenced circumstances are likely to be rewarded.
Finally, the biggest internal characteristic of the stock market at the moment is the propensity of algos to buy the dips, which is a sign that traders are buying the dips. Thus, until this trading pattern changes, it seems like a viable strategy.
I own MU and TXN.
Joe Duarte has been an active trader and widely recognized stock market analyst since 1987. He is author of Trading Options for Dummies,


