

While WB appears to have made a major technical breakthrough, there is another level technician to pay attention to, writes Elizabeth Harrow.
The U.S.-traded shares of Chinese microblogging site Weibo Corp (WB) staged a technical victory earlier this month, when they broke out above their 200-day moving average for the first time in nearly a year. This long-term daily trendline had previously acted as firm resistance since it was breached in May 2018, having rejected subsequent WB rally attempts in mid-June and again in late February and early March.
As of this writing, WB is on pace for a fifth consecutive daily close above its 200-day moving average, and in the process of pulling back for a re-test of support at this newly taken-out trendline. In addition to eyeing the outcome of this imminent re-test of the 200-day, traders should also be aware of a significant longer-term moving average for WB that's just overhead -- and could have bearish implications going forward.
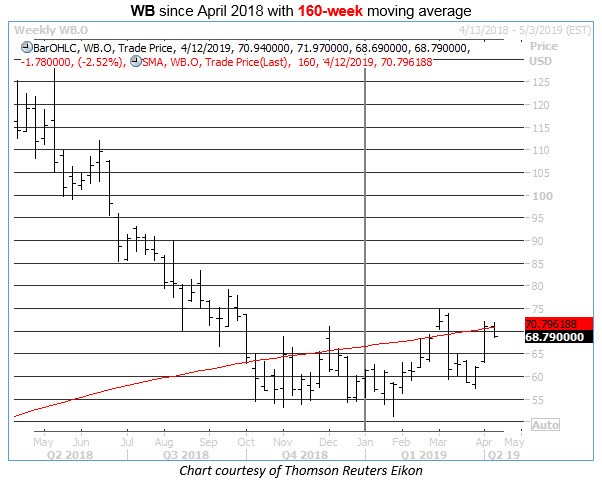
Specifically, WB is trading within one standard deviation of its 160-week moving average — a trendline that it's spent most of its time below during the past 20 weeks, according to Schaeffer's Senior Quantitative Analyst Rocky White (see chart below). There's just one prior occurrence of WB rallying up to test resistance at its 160-week moving average after such a lengthy stretch beneath it, and it occurred earlier this calendar year. Following that prior signal, WB stock was down 6.02% four weeks later.
The presence of the 160-week moving average is worth mentioning in the context of the 200-day breakout for a couple of reasons. Very broadly, we've found that traders who are hyper-focused on targeting short-term price moves can sometimes neglect to consider a stock's longer-term chart setup, which can lead to crucial support and resistance levels — like the WB 160-week— getting missed. And more specifically, after closing above its 160-week last Friday in the early throes of its surge above the 200-day, WB has now reversed back down below its 160-week moving average, in a pattern that so far appears to mirror the "head fake" above this trendline during the final week of February.
Currently, the 160-week moving average is located just below the $71 level, which technicians will note corresponds pretty closely with the $71.06 price point marking a half-high of the stock's Feb. 15, 2018 intraday peak at $142.12. In fact, on April 5 — the Friday where WB closed above its 200-day moving average for the first time in about 11 months— the stock settled the session squarely at that half-high of $71.06.
Plus, $70.12 marks a 20% year-to-date return for WB, adding another layer of "round-number return" significance around the $70 level and that 160-week moving average.
That said, there's enough short interest remaining on Weibo— 7.7% of the stock's float, or 5.2 times its average daily trading volume— for the shares to catch a healthy bid higher in the event of any positive news, or potentially following a successful re-test of the 200-day. But with key resistance levels just overhead, traders should wait for confirmation that these technical obstacles have been taken out (as evidenced by successive Friday closes above the 160-week) before going long.


