The MACD indicator is showing signs of weakness in SPX, though it has recent misses, says Marvin Appel.
Our U.S. equity timing model has switched from “buy” to “hold”. Although the S&P 500 Index has been overall profitable during hold conditions, risk is higher than when our model is on a buy. Moreover, I am suspicious about the market, which has stalled after its third approach to 2900 since January 2018.
The longer-term perspective is also concerning, with a number of indexes poised to form negative divergences with their monthly MACDs. This bearish chart formation has occurred only rarely in the past—too rarely to rely on as a trading signal — but has preceded major bear markets. I discuss a more sensitive indicator based on the monthly MACD of SPY (below), and this too is flashing a warning.
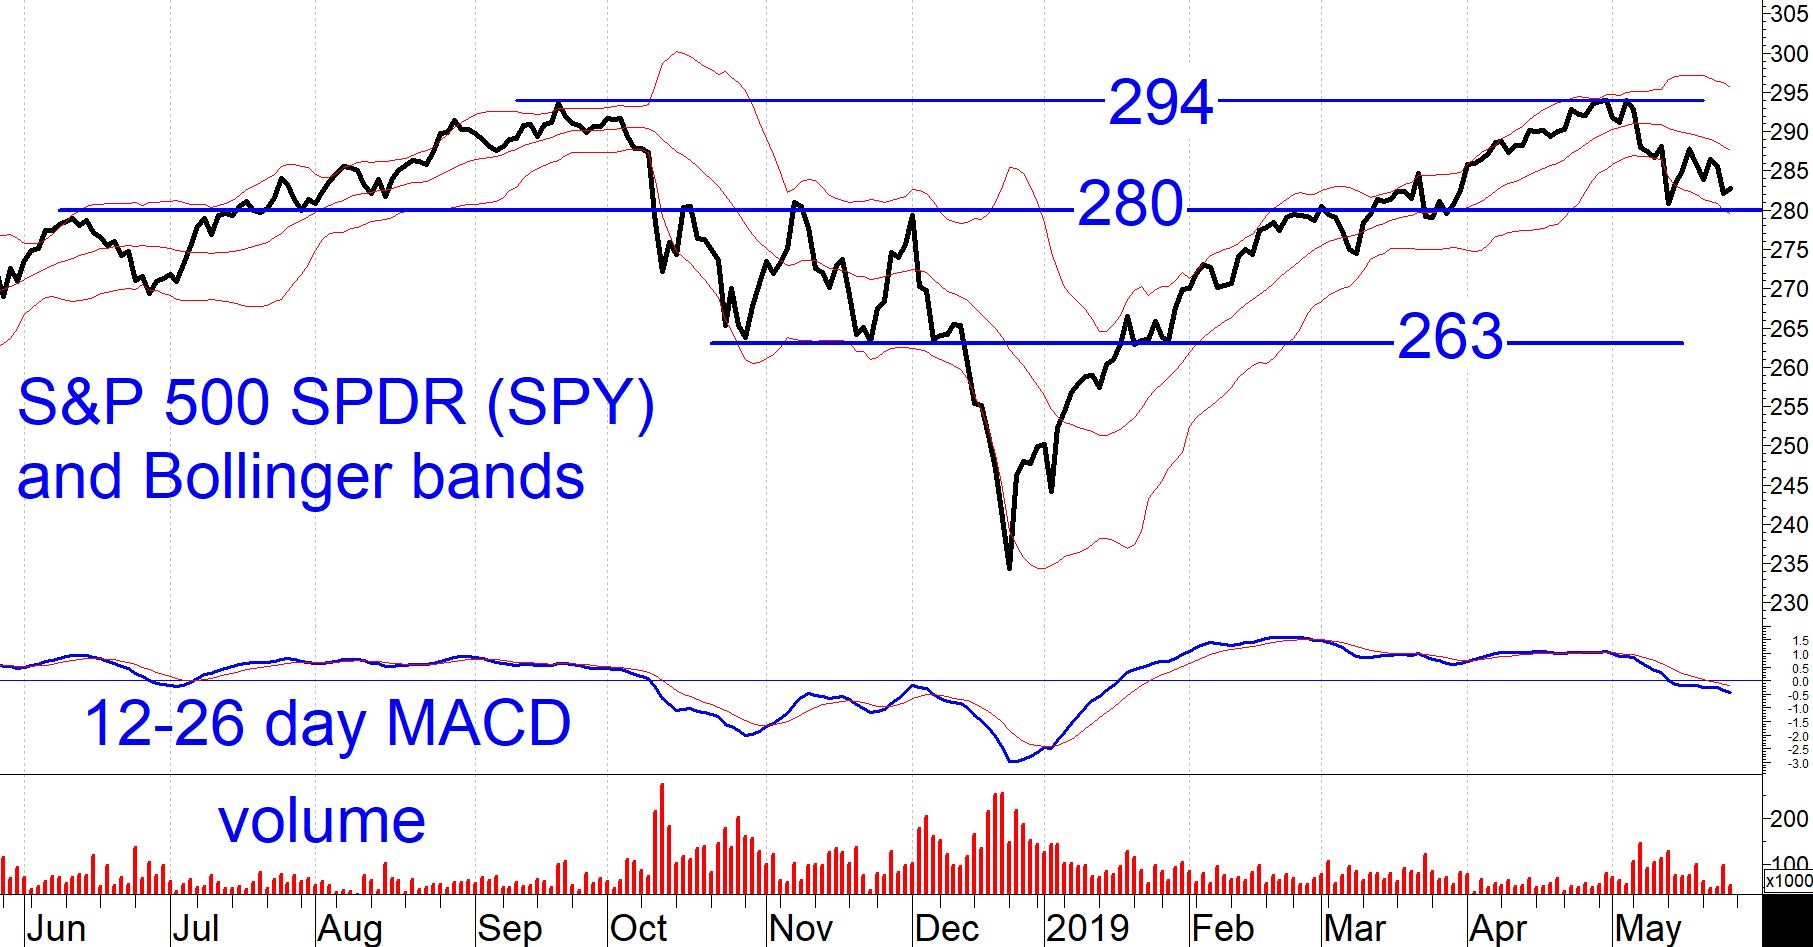
There is some reason for optimism in the near term. For one, market sentiment (as summarized by Ned Davis Research) is quite negative. Historically, periods when sentiment has been negative with our model on “hold” have been quite profitable for the market. For another, the 280 support level for SPY remains intact. (See chart below)
Putting this all together: I believe near-term and longer-term caution for stocks is warranted despite our U.S. equity model being on hold. My equity outlook is for overall sideways movement over the next several months, with bouts of elevated volatility in response to news. This is not a market where the bulls stampede ahead regardless of the news, but rather one where participants seem to be itchy.
As I have said before, the risk-reward balance favors corporate high yield bonds. As of this writing the S&P 500 SPDR (SPY) is approximately 4% off of its high, which corporate high yield bond funds are overall approximately 1.1% off of their highs not counting accrued interest of approximately 0.4% this month. This is a typical volatility ratio between stock market indexes and diversified corporate high yield bond funds
Monthly MACD warning
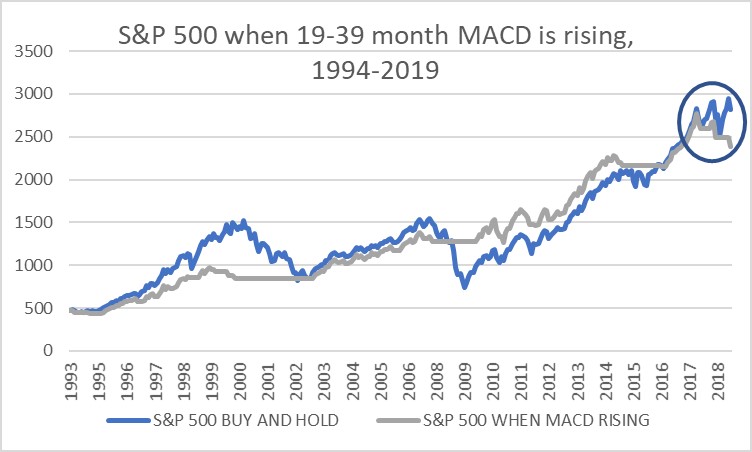
The direction of the 19-39 month MACD of the S&P 500 Index has had a good record of separating risky from safer market climates. When the 19-39 month MACD is higher than the previous month, you hold S&P 500 (or SPY) for the coming month. If this month’s 19-39 month MACD is lower than in the previous month, you move to cash for the coming month. As of this writing, it appears likely that the 19-39 month MACD of the S&P 500 Index will be lower on May 31 than it was on April 30. If that does come to pass on May 31, this indicator would have you in cash for the month of June.
The track record of this indicator is not as good as that of our U.S. equity timing model. As a result, we are not trading client assets based on the monthly MACD. Nonetheless, this indicator can help us formulate expectations.
The chart below shows how the S&P 500 Index has performed over the past 25 years when MACD was rising compared to buying and holding (Interest, dividends, taxes and transaction costs were not factored in).
Overall, buying and holding was a bit more profitable. However, trading based on the monthly MACD would have spared you most of the drawdowns of the 2000-2003, 2008 and 2015 market declines. Trading based on MACD would have missed big gains in 1998-2000 and 2009. My biggest concern about this indicator is how poorly it performed in the past year and a half (circled), when it was whipsawed three times to get stopped out after declines had already occurred. In view of the difficulty this indicator has in handling the “V”-shaped market corrections and recoveries of 2018-2019, I would not depend on it solely to trade now. Rather, I view the monthly MACD as just one more piece of evidence that market risk is increasing.