

A temporary market top is in, but the selloff may lead to a greater long opportunity down the road, writes Avi Gilburt.
The Federal Reserve gave us exactly what the market expected, a 0.25% rate cut, and even gave us a bonus with the early cessation of Quantitative Tightening (returning to repurchasing expiring bonds immediately instead of at the end of September). Normally, most would view this as a bullish catalyst. However, with market sentiment topping out in a bullish extreme, market participants interpreted the Fed action as bearish (despite its positive substance), and the market sold off this past week.
My analysis indicates that we now have a top in place. The question is what will that top represent?
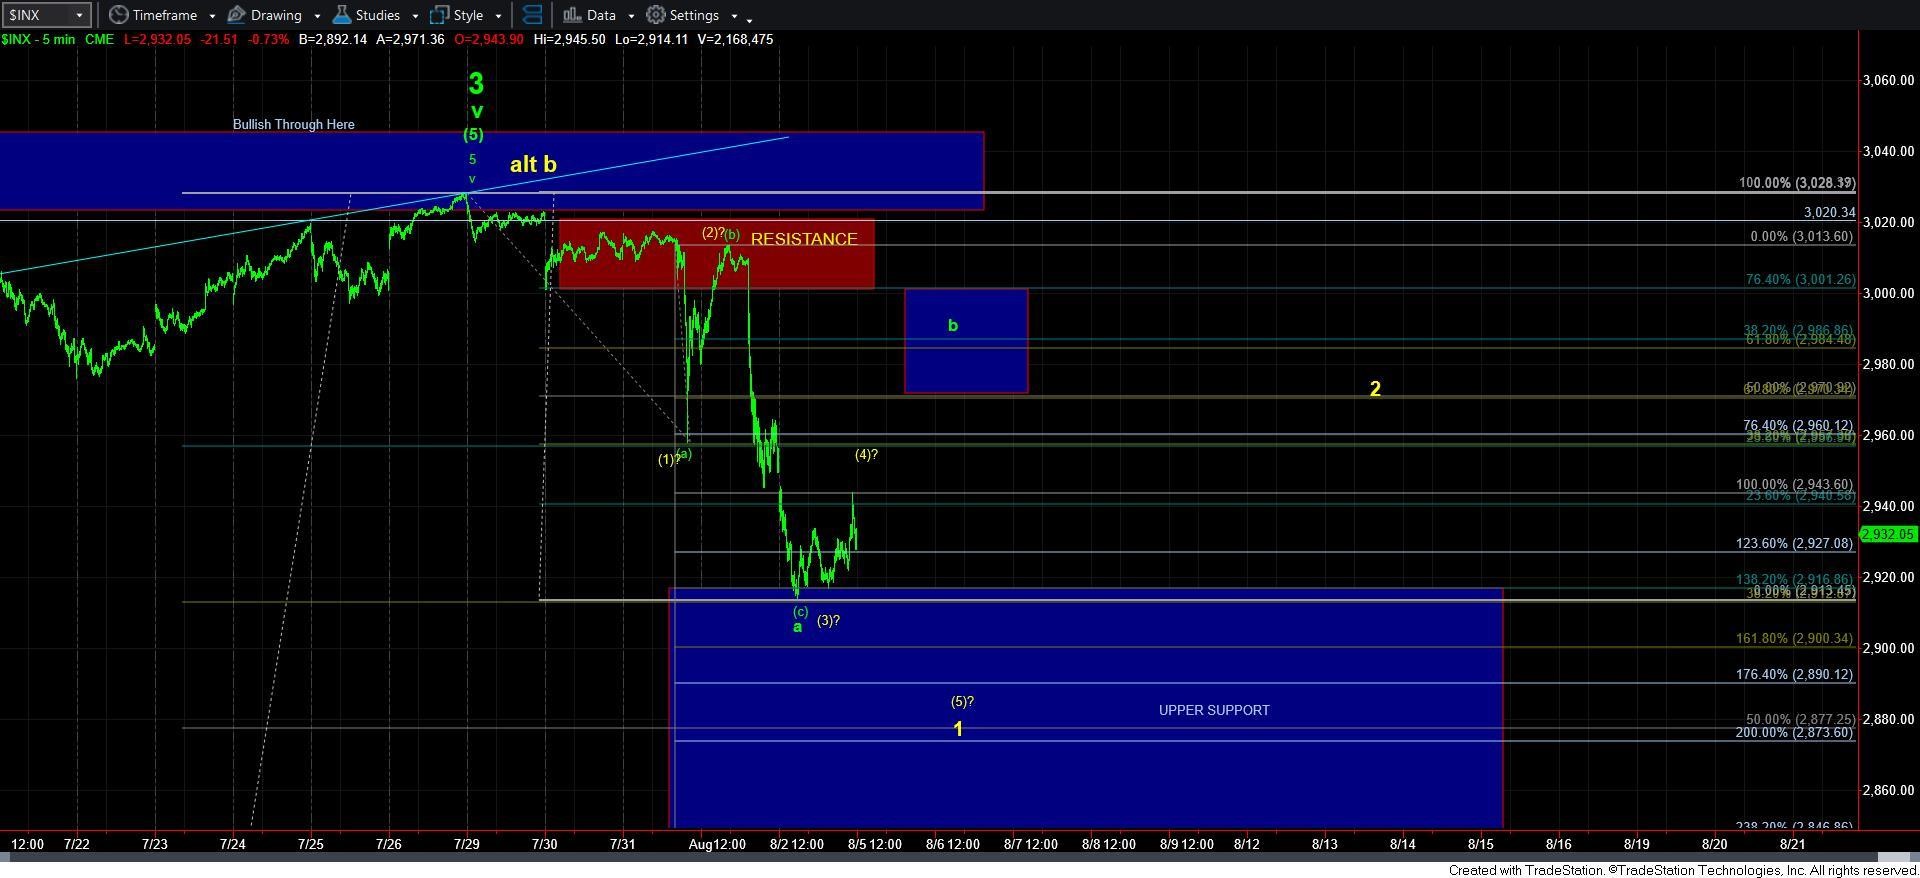
It is impossible to answer that question to any level of high probability just yet, as much will depend on the action we see on today. If the market continues lower and completes an Elliott Wave 5-wave structure to the downside off the recent highs (which looks apparent as you read this), that would suggest we may be setting up for a very ugly summer and fall.
However, if the market recovers before the close, then it means we have begun a very volatile and choppy market phase, with the market pointing us much lower in the coming weeks/months, but in stair step fashion. The difference between these two scenarios is the speed at which the market can drop. The first and likely scenario would take the market down quite strongly and fast, whereas the latter alternative will likely be more of a stair step move down and have many more up/down phases.
In the bigger picture, major support for this market resides in the 2600-2766 region on the S&P 500 (SPX), and I expect that we will likely test that support in the coming weeks/months (see charts below). How the market rallies off that support will likely tell us if we have begun our final 5th wave rally off the 2009 lows, pointing to the 4000 region, or if the market still has lower to go, with potential to take us back down into the 2200 region as we look towards 2020.
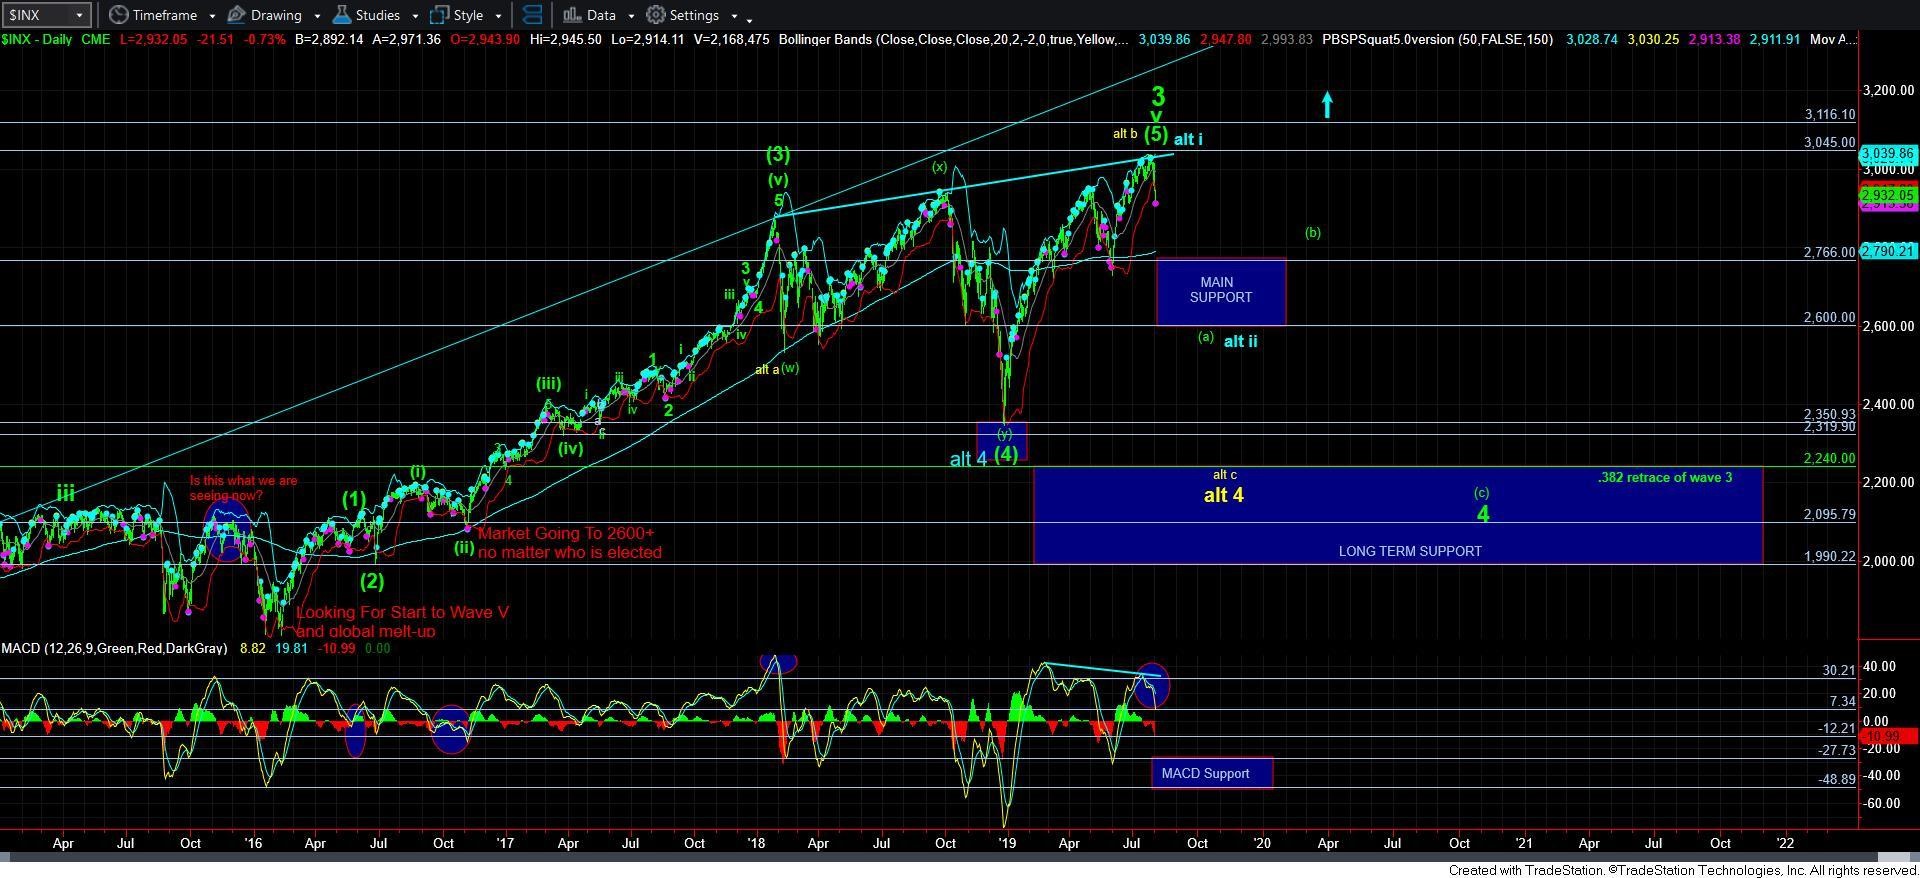
Since most of you view this market from a longer-term perspective, I want you to maintain a focus upon one thing. Please keep in mind that my expectation remains that this market can rally up towards the 4000 region by 2022/23. That means that we have 1100 points of potential upside overhead from where we closed on Friday, with as much as 700 points of potential downside below us, assuming we see the fullest correction that I would expect. That means that as the market continues lower towards the 2600-2766 SPX support region in the coming weeks/months, it will be giving you a bigger opportunity to buy stocks that will undoubtedly be on sale. Take advantage of this opportunity.
Lastly, I also want to note that the next time the market rallies above the 3027 SPX level at which we recently topped, and follows through over 3115, that will be a strong signal that market has begun its rally to the 4000 region. While my preference is to still see much lower levels before that rally begins in earnest, you need to understand where to abandon expectations for more of a correction to take hold.
And, since I have begun to cash out of my TLT trade after gaining 20% since our entry in early November of 2018, traders should look to redeploy that money into the stock market over the coming months to prepare for the rally I expect to take us to the 4000 region by the 2022/23 time frame.
Avi Gilburt is a widely followed Elliott Wave analyst and founder of ElliottWaveTrader.net, a live trading room featuring his analysis on the S&P 500, precious metals, oil & USD, plus a team of analysts covering a range of other markets. He recently founded FATRADER.com, a live forum featuring some of the top fundamental analysts online today to showcase research and elevate discussion for traders & investors interested in fundamental rather than technical analysis.


