

Rising trade tensions destabilize stocks and the bond market is telling the Fed to become more aggressive as recession fears mount, writes Marvin Appel.
The Federal Reserve cut the Fed Funds rate by 25 basis points on July 31 as expected. It turned out to be a case of buy the rumor, sell the fact, as the S&P 500 SPDR (SPY) had already peaked on July 29. Then President Trump, apparently unhappy with the lack of commitment from the Fed for an extended easing cycle, announced a new round of tariffs on imports from China in response to the lack of progress on trade—the very justification Fed Chair Powell used cutting rates in an otherwise positive economic outlook!
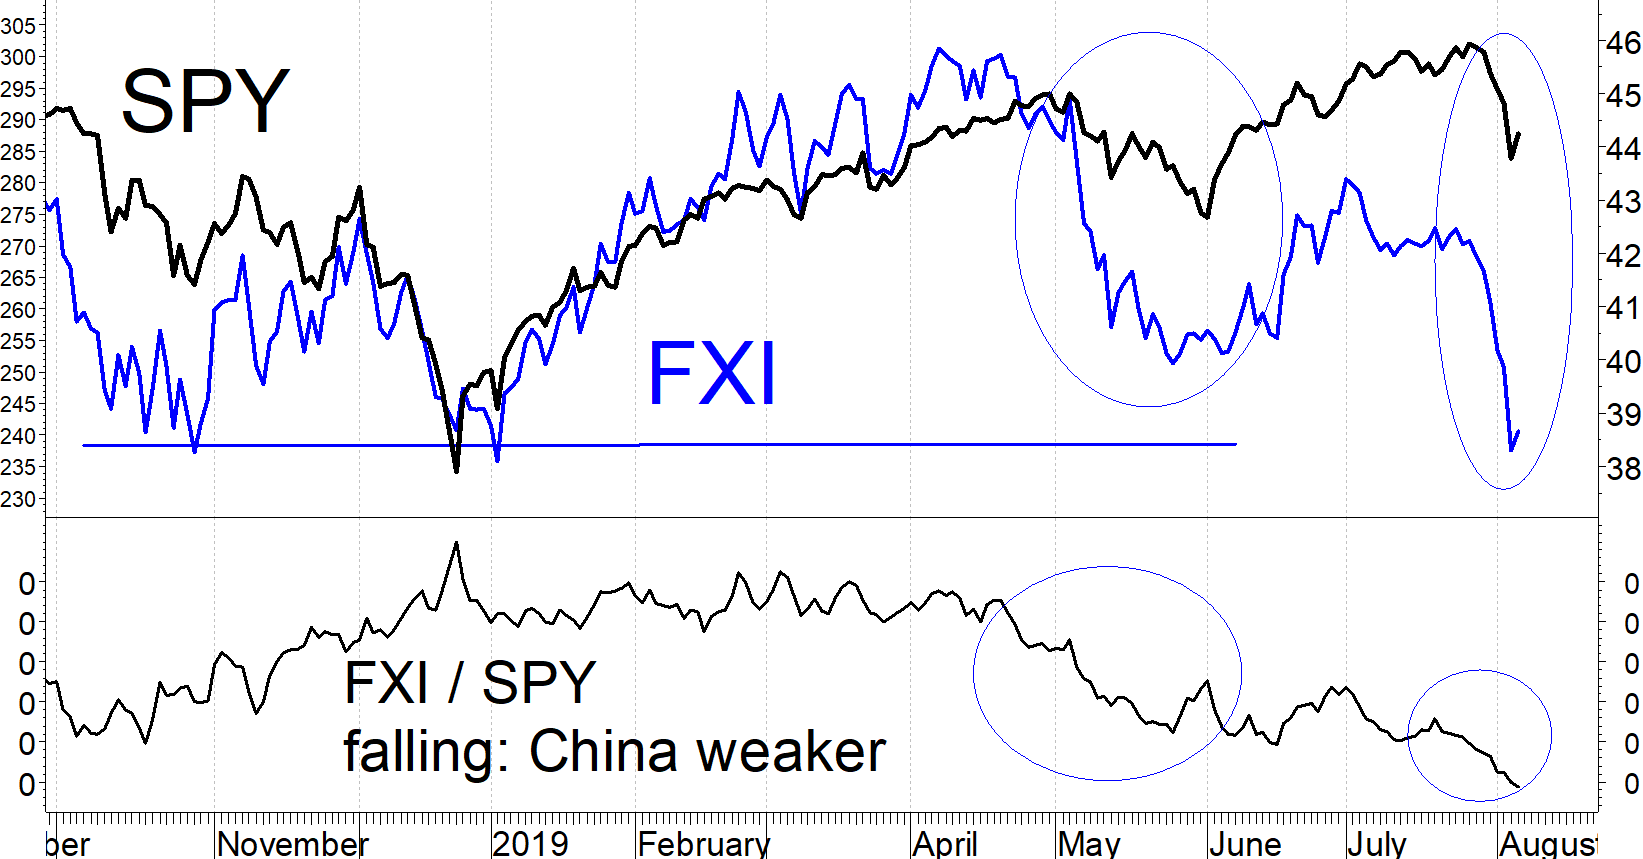
How do we know that China worries played a big part in the stock market decline? The chart below confirms that during the last two market retracements, the large-cap China equity ETF (FXI) fell faster than SPY.
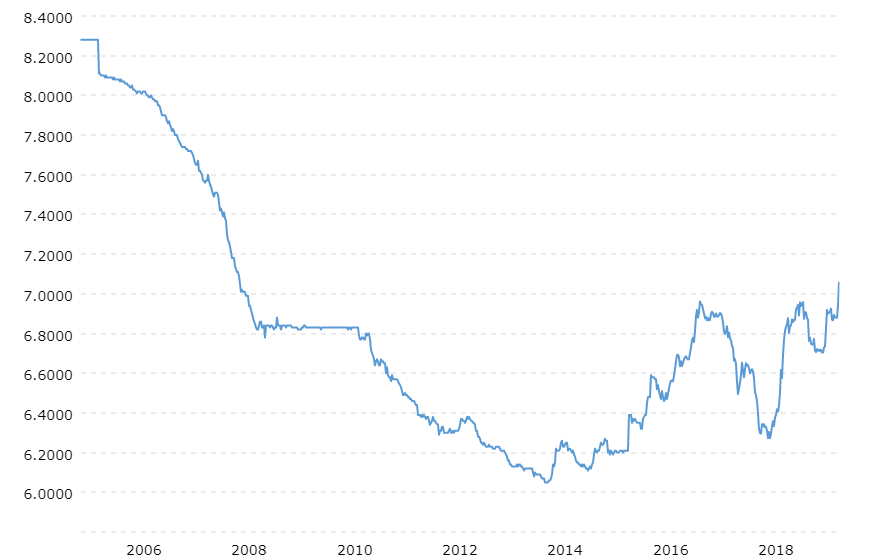
Although President Trump just designated China a currency manipulator (a move without any practical significance since tariffs have already been imposed), China’s yuan has been in a strong downtrend since early 2018 and is now at its weakest level compared to the U.S. dollar since 2008. (See chart below.) In fact, it appears that China is about to step in to block the fall in its currency.
At this point it looks like the stock market has adjusted to the trade situation. Intra-day lows on Aug. 5 and Aug. 7 were in the 282 area for SPY. This is higher than the 273-level touched on June 3, the nadir of a decline also brought about by a deterioration in the trade situation. However, the bond market is more worrisome in terms of longer-term outlook and recession risk.
The chart below shows the ratio of inflation-protected Treasuries to nominal Treasuries (TIP/IEF) and the yield on 10-year Treasury notes. When the iShares TIPS Bond ETF (TIP) are stronger than nominal Treasuries as represented by the iShares 7-10 Year Treasury Bond ETF (IEF), it indicates that inflation expectations are increasing. Conversely, when IEF is stronger than TIP it indicates waning inflation fears which, in the current setting means the threat of a slowing economy.
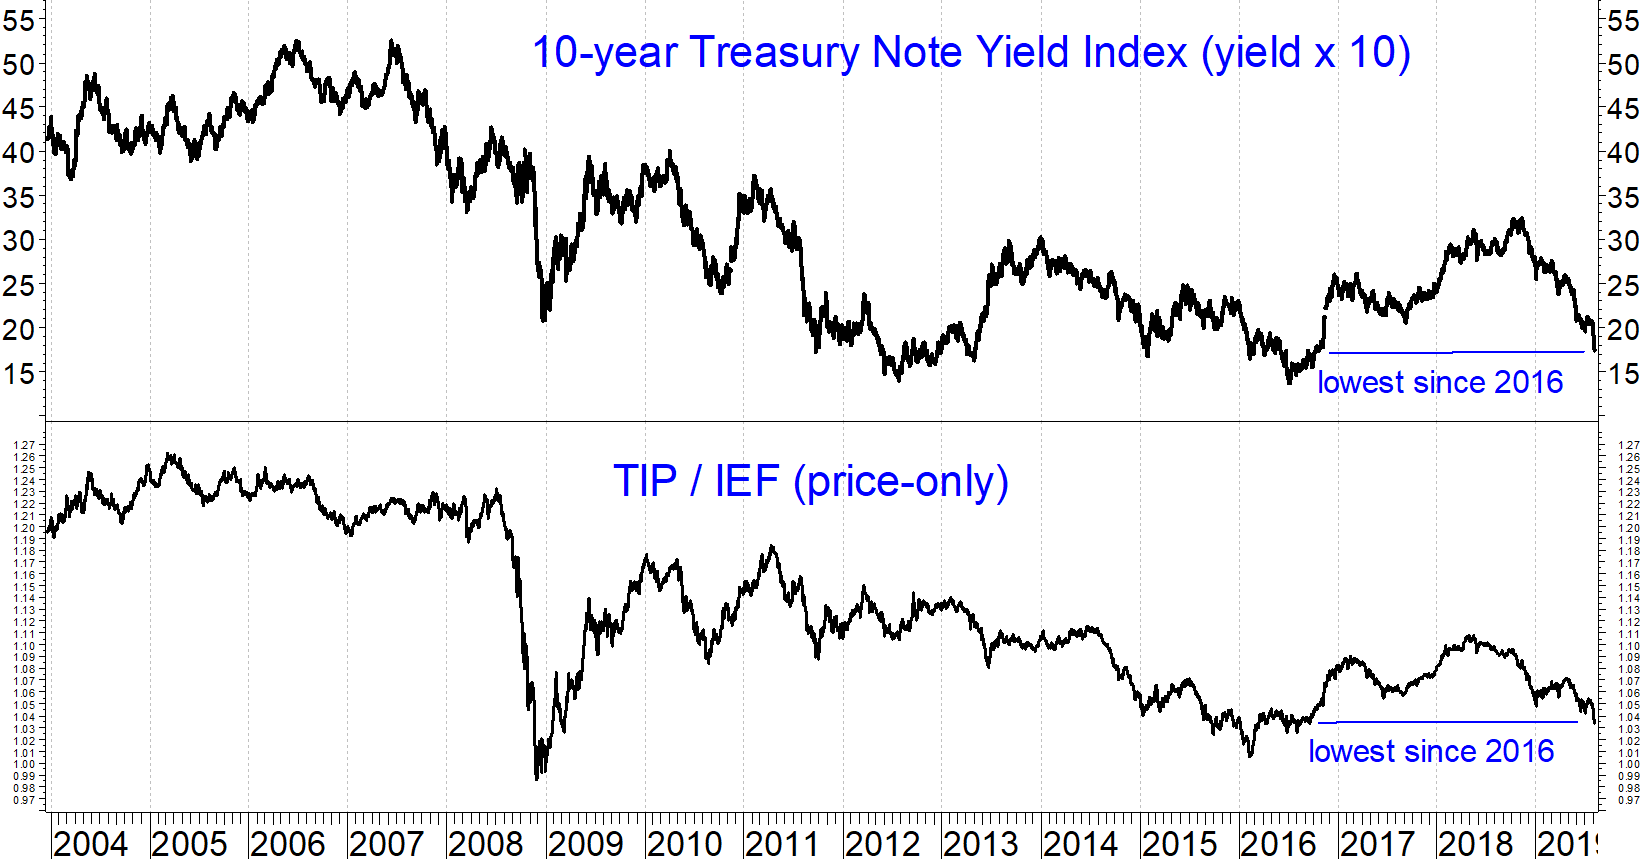
Both 10-year Treasury note yields and the TIP/IEF ratio are now at levels close to what we saw in early 2016. In addition, the spread between two- and 10-year Treasury note yields shrunk to 7 basis points as of Aug. 7. That is a flatter yield curve than we saw even at the depths of the fourth quarter 2018 market decline. So even though the stock market is far higher now than it was on Christmas Eve 2018, the Treasury bond market is signaling more economic bearishness than it did at the last stock market bottom in 2018.
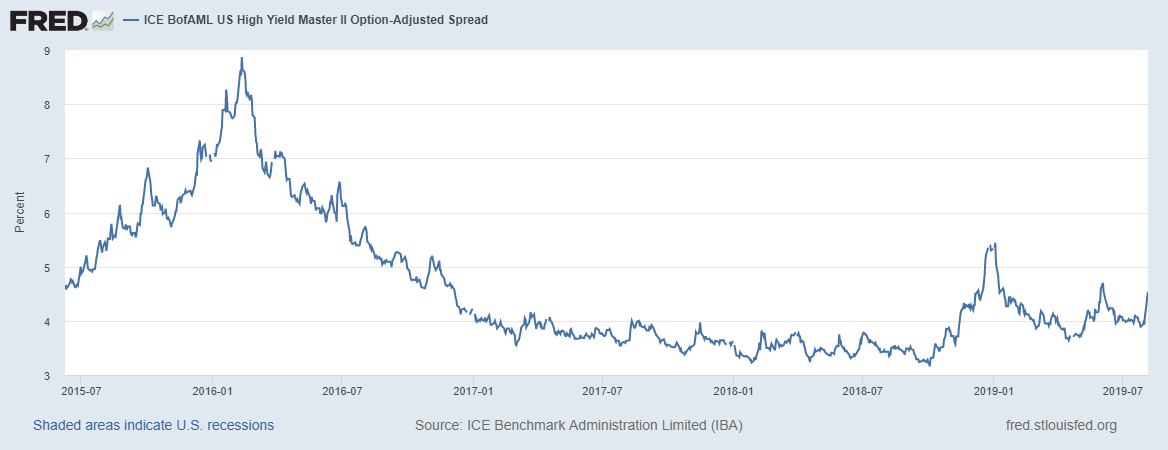
In contrast to Treasuries, high yield bond spreads do not (yet) reflect as much economic pessimism as we saw in December 2018. They remain tighter than they were at the nadir of the 2018 market and well below the levels reach in 2015-2016, which was the last significant recession scare (See chart below). The wider the spread between high yield bond yields and Treasuries, the more extra yield the bond market is demanding for taking on the credit risk of junk bonds, indicating pessimism of the economy. It remains to be seen whether high yield bonds fall further or whether they will hold their ground. As long as our high yield bond fund timing model remains on a buy signal, we will give high yield bonds the benefit of the doubt.
Implications
The Treasury bond market is signaling the most pessimism regarding the economy since 2016 while the jury is out regarding how much further high yield and floating rate bonds will fall. I view this as the bond market’s strong signal to the Federal Reserve that recession risks have returned and that more aggressive Federal Reserve easing will be required, notwithstanding the current good economic data in the United States.
The stock market is on a hair trigger, rising or falling 2% or more intra-day on news developments. The level to watch is 273-274 for SPY which is the June 3 low; for now, that appears to be the limit of downside risk. If that low is taken out, however, we could see a replay of the December decline.
This is a time to be cautious. We have reduced our clients’ equity exposure as the result of our model’s Aug.1 sell signal and are keeping a close eye on our high yield bond fund timing models since a potential sell signal is close at hand.
Sign up here for a free three-month subscription to Dr. Marvin Appel’s Systems and Forecasts newsletter, published every other week with hotline access to the most current commentary. No further obligation.


