

With many markets, and sectors, depending on the U.S. Dollar as indicator, it is time to look at what the QuantCycles Oscillator is showing for the dollar, writes Dan Collins.
In looking at the various analysis of stock, bonds, energies and numerous sectors, one element continues to be cited: The U.S. Dollar.
Have you seen an analysis of crude oil or gold without a reference to the dollar? Gold is particularly interesting because worries over the economy, geopolitical risk and domestic political turmoil all feed the gold bug machine. Gold often performs as a hedge against inflation, but where it really shines is when there is fear (not necessarily blood) in the water.
The U.S. Dollar is often seen as negatively correlated with gold, though both can be seen as safe-haven assets in times of stress.
With that in mind, let see what the QuantCycles Oscillator is indicating for the dollar (see chart).
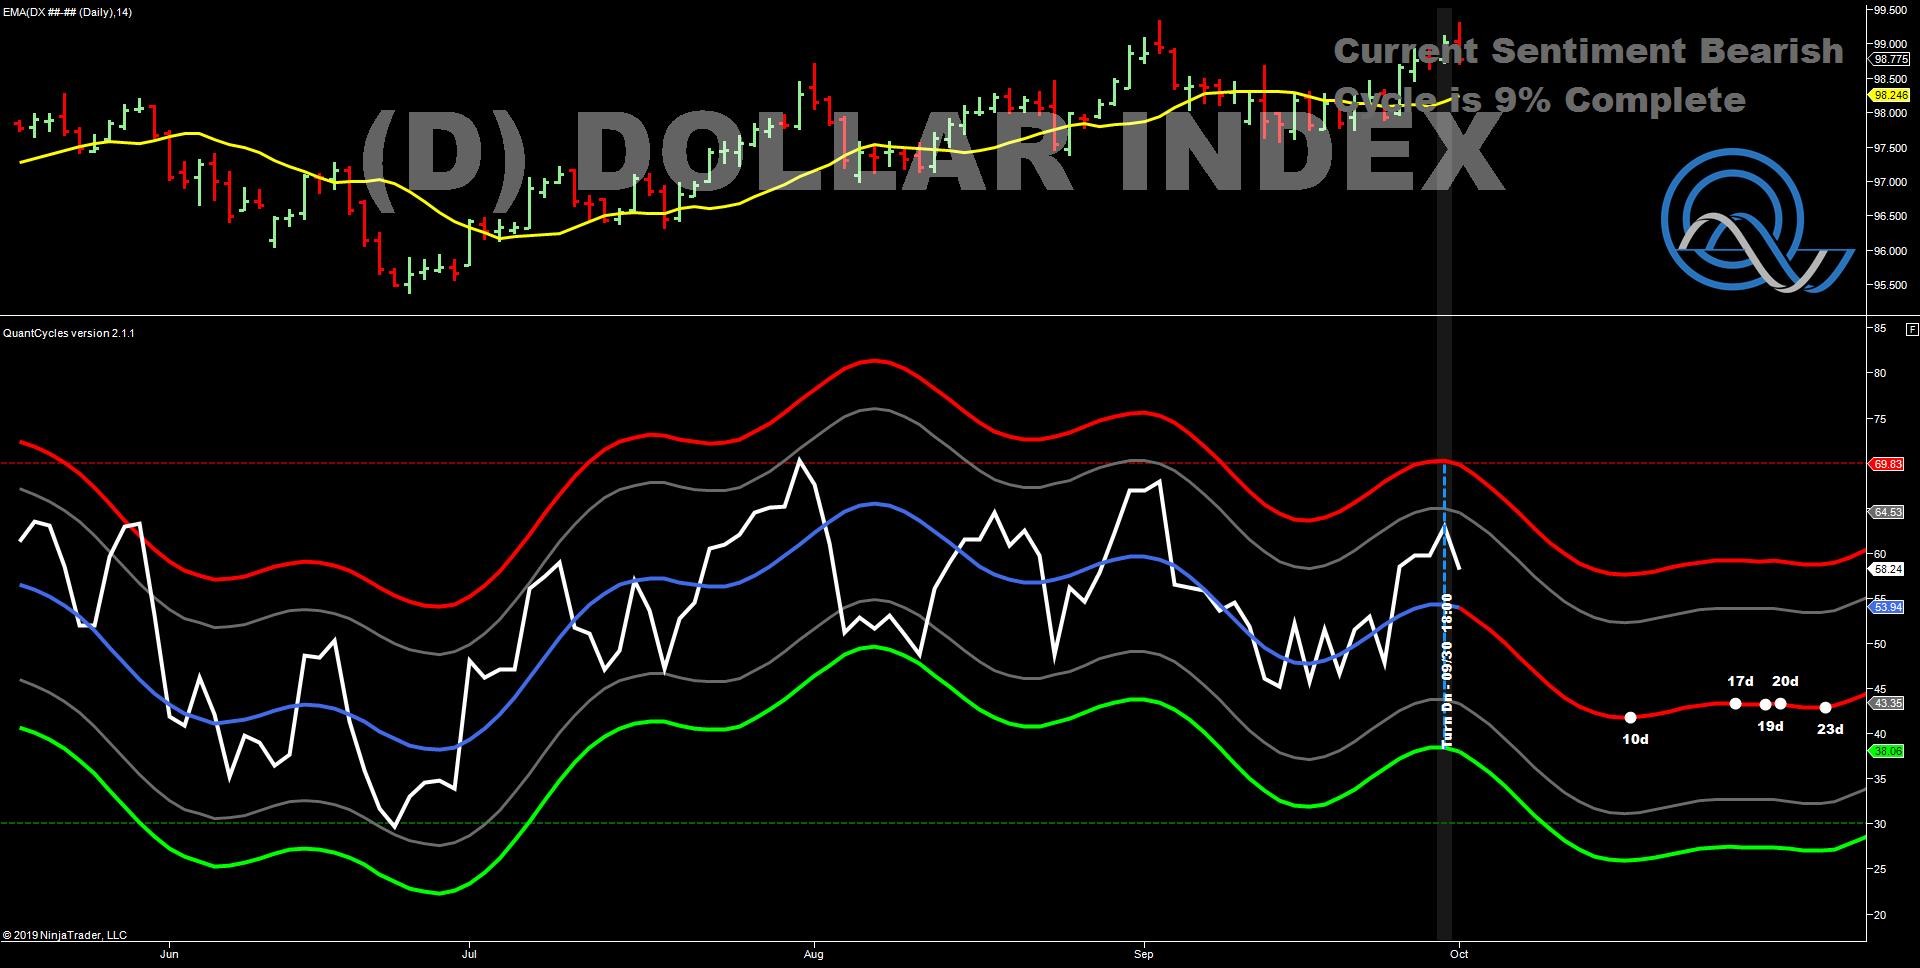
As you can see the U.S. Dollar Index has recently made a double top just as the daily QuantCycles Oscillator has turned lower. The oscillator expects the dollar to continue to fall over the next weeks, adjust your outlook accordingly.
One of the main reasons there has been a focus on the dollar has been the US-China trade dispute. There has been changes currency manipulation, which has made the dollar an even greater forecaster of broad market behavior.
The last few days there has been rumors of progress on a trade deal, which has buoyed soybeans. While not necessarily a sign of a deal, the idea that China would purchase more U.S. soybeans has been seen as a good faith maneuver. With rumors of trade progress came a rally in beans. Any observer over the last six months would know most of these trade rumors bumps reverse.
This is particularly interesting in beans, as the recent rally has pushed beans into overbought territory amid a QuantCycles downturn (see chart below).
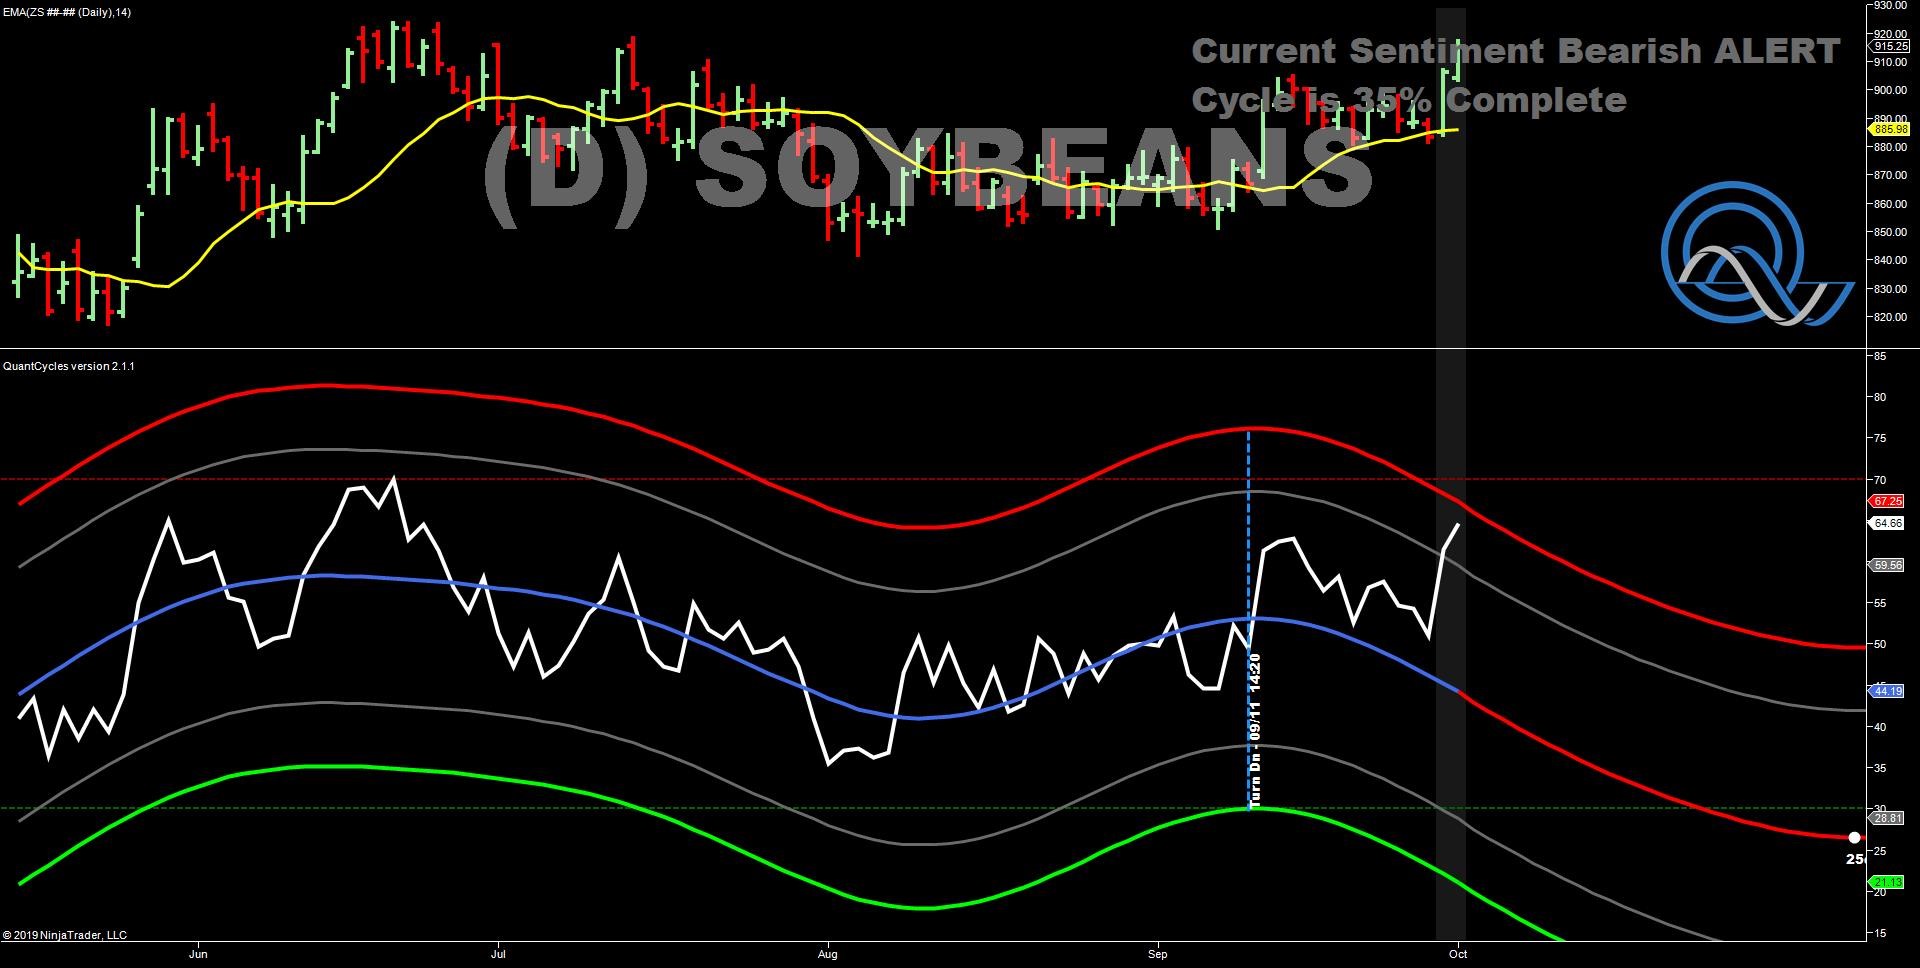
This is a strong sell signal as the recent strength has little fundamental or technical strength behind it. Beans our overbought and fundamental strength is already price in.
Past Performance
Last week we highlighted a potential sell in WFC, Tabb.
John Rawlins described the value of the QuantCycles Oscillator recently at The Orlando MoneyShow.
The QuantCycles indicator is a technical tool that employs proprietary statistical techniques and complex algorithms to filter multiple cycles from historical data, combines them to obtain cyclical information from price data and then gives a graphical representation of their predictive behavior (center line forecast). Other proprietary frequency techniques are then employed to obtain the cycles embedded in the prices. The upper and lower bands of the oscillator represent a two-standard deviation move from the predictive price band and are indicative of extreme overbought/oversold conditions.


