

U.S. Treasury bond has another leg to it, after correction, writes Al Brooks.
The 30-year U.S. Treasury bond futures have rallied strongly for the past two weeks. It will probably have at least a small second leg up after the first one- to two-week pullback.
Futures on the long bond market have traded sideways for six months. On the monthly chart (not shown), there were four consecutive bear bars after a 2019 parabolic wedge rally. That is a weak bull flag. Traders expect a second leg sideways to down.
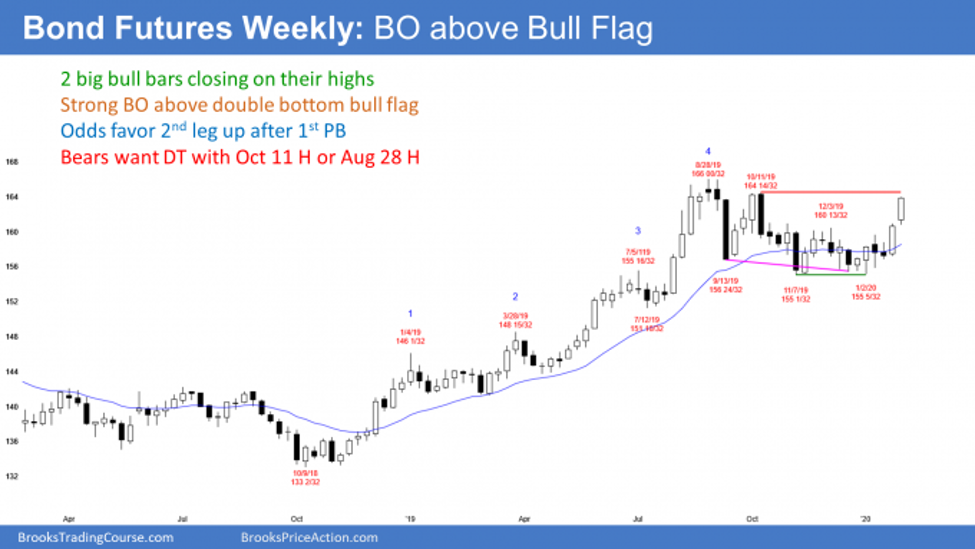
On the weekly chart, the past two weeks were big bull bars closing near their highs (see below). For the past six weeks, I have been saying that the bond market would rally. The bonds broke far above the three-month trading range two weeks ago. The breakout was surprisingly big. Traders therefore expect at least a small second leg up. As a result, they will look to buy the first reversal down. Consequently, the downside risk is small for the next couple weeks.
Conflicting signals on weekly and monthly charts
How should traders reconcile the monthly and weekly charts? The monthly chart should have a second leg sideways to down. It typically would come from a lower high.
The weekly chart should have at least a small second leg sideways to up. There is room to the all-time high for the weekly chart to have a pullback and a second leg up, with that second leg up staying below the August all-time high.
But even if the bulls get a new high, it will probably fail to go far above the August high. The six-month trading range will likely continue for at least a few more months.
What about zero interest rates?
I have noted before that the American public will not accept zero interest rates. Therefore, bonds probably cannot break far above the August all-time high.
Also, there is a 10-year nested wedge top on the monthly chart (I have shown it many times in prior Weekend Updates). Even though 2019 broke above the top, the breakout was small. The bond market is probably creating a top that will last for 20 years. Such a major reversal can take years to complete. It is like turning a supertanker on the ocean. The turn takes several miles. A turn in a 30-year bull trend takes several years.
Trading Room
Al Brooks will be speaking at the MoneyShow Orlando this week. Make sure to see his presentation—either in Orlando or live streamed through the web—on Trading When a Market Is in a Bull Channel.
Traders can see the end of the day bar-by-bar price action report by signing up for free at BrooksPriceAction.com. I talk about the detailed E-mini price action real-time throughout the day in the BrooksPriceAction.com trading room. We offer a two-day free trial.


