

Euro double bottom could signal a reversal, writes Al Brooks.
The EURUSD currency pair formed a bull reversal bar on its weekly chart and a double bottom last week (see below). But after four bear bars, the first reversal up will probably be minor.
The EURUSD currency pair broke below 1.10 last week and reversed up. The bulls see the reversal as forming a higher low double bottom with the Nov. 29 low.
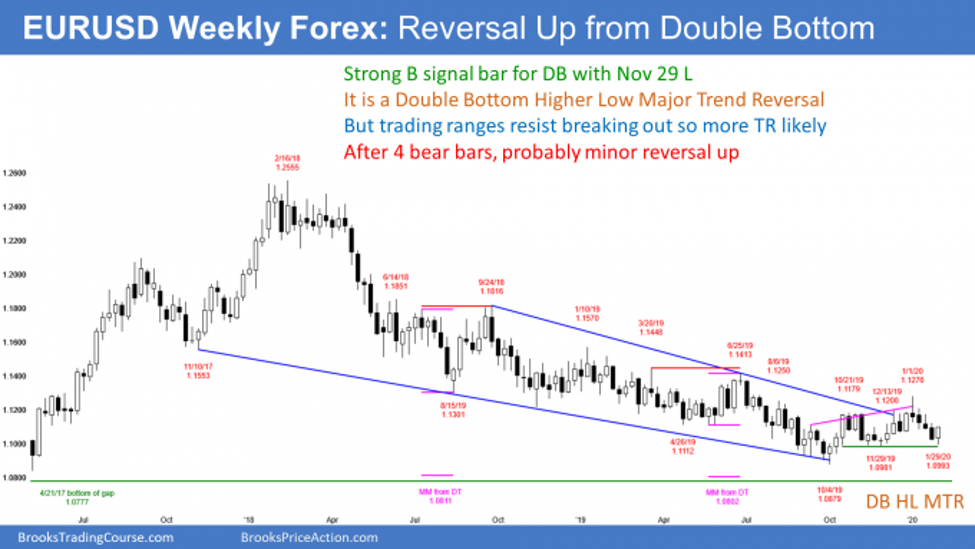
This is therefore a double bottom higher low major trend reversal. This week is a buy signal bar. But there have been many buy and sell signals for two years. None has resulted in a trend. Consequently, traders continue to look for legs up and down to reverse every few weeks.
After four consecutive bear bars, the first reversal up will probably be minor. This is true despite this week was being a big bull bar closing near its high.
Look at the swings up and down over the past year. All have had at least two legs. Traders expect that there will be at least a small second leg sideways to down before the bulls can get more than a three-week rally from here.
Where Will EURUSD Go This Month?
What happens if the weekly chart rallies for a few weeks and reverses down from a lower high? Traders will see the rally as the right shoulder of a head and shoulders top. The left shoulder would be the Oct. 21 lower high.
If however, the next several weeks are big bull bars and they break above the January high, traders will begin to believe that the two-year bear trend is reversing up into a bull trend.
Traders continue to believe that there will eventually be a rally to the September 2018 high. That was the start of the bear channel. The start of the bear channel is a reliable magnet.
It is currently not yet clear that the bear trend and six-month trading range have ended. Until they clearly have, the odds are that they have not. Traders will continue to look for reversals every few weeks.
January Outside Down Candlestick
January traded above the December high and then below the December low. It therefore formed an outside down candlestick on the monthly chart (not shown).
While an outside down bar can be bearish, context is important. The monthly chart has been in a tight trading range for six months. An outside bar in a tight trading range does not change the pattern. The chart is still in a tight trading range.
That is a limit order market. Consequently, there will probably be more buyers below the prior bar than sellers. It is more likely that February will be another sideways bar than the start of a bear breakout.
Trading Room
Al Brooks will be speaking at the MoneyShow Orlando this week. Make sure to see his presentation—either in Orlando or live streamed through the web—on Trading When a Market Is in a Bull Channel.
Traders can see the end of the day bar-by-bar price action report by signing up for free at BrooksPriceAction.com. I talk about the detailed E-mini price action real-time throughout the day in the BrooksPriceAction.com trading room. We offer a two-day free trial.


