

Despite last week’s bearish reversal in the EURUSD currency pair, the two-year bear trends in likely over, reports Al Brooks.
The EURUSD currency pair broke strongly above its 18-month bear trend line. The two-year bear trend is probably over. Last week’s strong bear reversal will probably lead to a one- to two-week pullback.
The weekly chart on the EURUSD formed a big bear reversal bar after two huge bull bars. The rally was the strongest in two years (see chart). It broke far above the 18-month bear trend line and above the January major lower high. Traders are concluding that the two-year bear trend has ended.
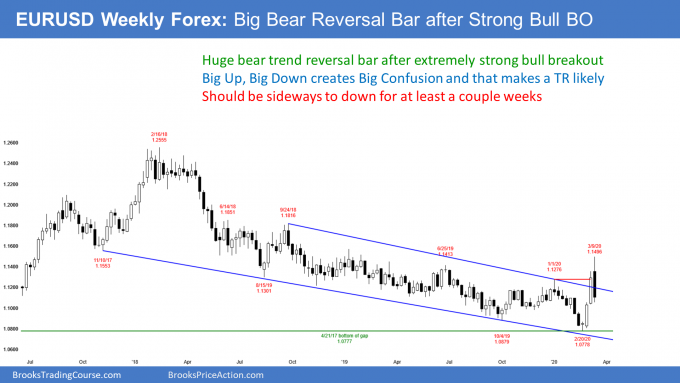
The end of a bear trend means either the start of a bull trend or of a trading range. A trading range is more common. This week’s big bear bar increases the chance of a trading range for at least a few weeks. Big Up, Big Down means Big Confusion. Confused traders are quick to exit positions. This limits the movement up and down and typically creates a trading range.
Second leg up likely after pullback
Whether this is the start of a bull trend or just a strong bull leg in what will be a trading range, the rally was strong enough so that traders will expect at least a small second leg sideways to up.
However, it was so extreme that the bulls are exhausted. Exhausted bulls typically take at least partial profits. They usually do not look to buy again just a few bars later. If that was their plan, they would hold long.
They know many bulls will take profits and bears will begin to sell. The bulls typically give the bears at least a couple chances to create a bear trend. After two legs sideways to down, the bulls will decide if the bears are failing. If they see a good buy setup, they will buy again, looking for a resumption of the bull trend.
On the other hand, if the selling keeps drifting down for 10 or more bars, the bulls will continue to wait. If the selloff lasts a month or more and retraces 60% or more of the rally, traders will conclude that the bull breakout was the start of a trading range and not a bull trend.
What about next week on the daily chart?
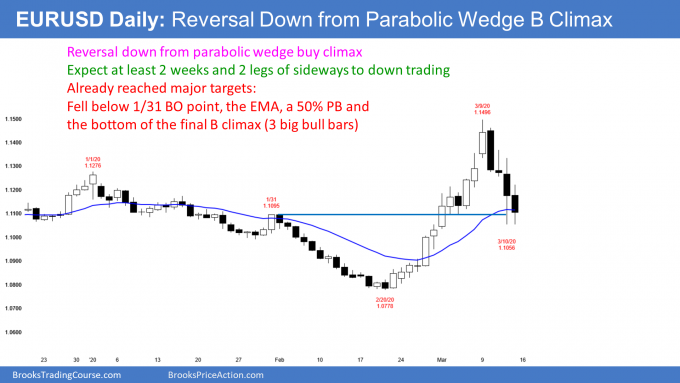
This week’s reversal down was big enough to make traders think that significant profit taking has begun. They therefore expect a couple legs sideways to down over the next couple of weeks.
The first target is the bottom of the most recent buy climax. On the daily chart, that is the low of last week’s three big bull bars (see chart below). That is around the January high, which is a breakout point and therefore a magnet. Additionally, it is around the magnet of the 20-day exponential moving average. Another common target is a 50% pullback. Thursday’s selloff reached all of those targets.
Some bulls will buy above the high of the previous bar on the daily chart, hoping that the bull trend will quickly resume. After four consecutive bear bars, there will probably be more sellers than buyers above bars for at least a couple weeks. The bulls will have a higher probability of making money if they wait to buy until the EURUSD has couple legs sideways to down and begins to form bull bars.
Trading Room
Traders can see the end of the day bar-by-bar price action report by signing up for free at BrooksPriceAction.com. I talk about the detailed E-mini price action real-time throughout the day in the BrooksPriceAction.com trading room. We offer a two-day free trial.


