

The rebound in stocks has likely peaked, trade the chart that is in front of you and not the one you hope it becomes, advises Al Brooks.
The E-mini S&P 500 is turning down from a nested wedge rally on the daily chart. Last week is a good candidate for the start of a two- to three-week pullback.
The E-mini S&P 500 futures chart formed a big bull bar in April on its monthly chart (see below). Its high is below the March high and its low is above the March low. April therefore was an inside candlestick. It got back to the February close and therefore erased the March collapse. Furthermore, the 2.5-year trading range is within a 12-year bull trend. These factors make April a credible High 1 bull flag buy signal bar.
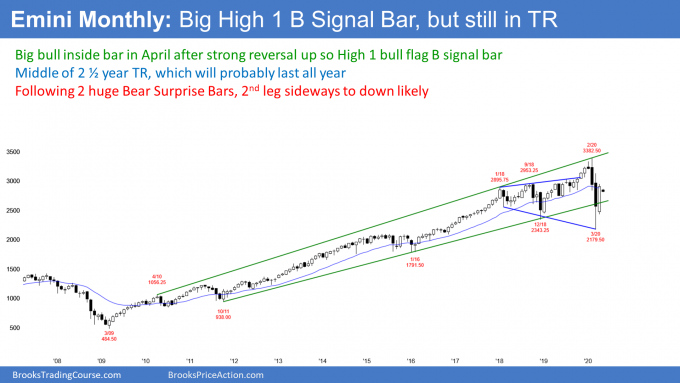
Traders expect May to go above the April high and trigger the monthly buy signal. But a buy signal in the middle of a trading range after a huge selloff is minor. It will probably not lead to a new all-time high
It is important to note that as strong as April was for the bulls, February and March were even stronger for the bears. Big Down, Big Up creates Big Confusion. Confusion and disappointment are hallmarks of a trading range.
The big bull bar was disappointing for the bears. If May goes above the April high, it will trigger the monthly buy signal. But because February and March were surprisingly strong, a rally from here will probably fail to get above the February high. That would disappoint the bulls. Consequently, the 2.5-year trading range should continue. Traders expect it to last all year.
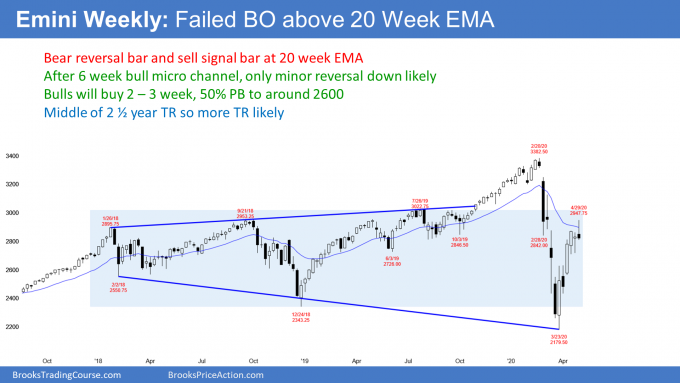
The E-mini reached the 20-week exponential moving average (see weekly chart below). I wrote about this last weekend. I said that the 20-week EMA was important resistance. Since the rally was strong and the E-mini was near the 20-week EMA, the E-mini was likely to get above the EMA last week.
However, I also wrote about the previous week being a doji bar in a buy climax. There are now six weeks where every low is above the low of the prior week. That is extreme, especially after a huge selloff. It is therefore a buy climax.
Also, the week of April 20 was an inside bar in a five-week bull micro channel. It was a buy signal bar in a strong bull trend. Traders expected last week to go above the previous week’s high and trigger the buy signal.
And it did. But when there is a doji buy signal late in a buy climax, the breakout typically fails within a week or two. I said that a doji buy signal bar with a big tail below often leads to a doji entry bar with a big tail above. While this past week was not big, there was a prominent tail on top. This is consistent with what I said.
Additionally, I said that the doji buy signal bar in a buy climax is often a one-bar Final Bull Flag. That means there is an increased chance that the breakout above will fail.
Failed breakout above High 1 buy signal bar
Was last week a failed breakout above a buy signal bar? It might be, but while it has a bear body, it is not a big bear bar closing on its low. Last week is therefore not a strong sell signal bar. It is at the resistance of the 20-week EMA, which is good for the bears.
However, a reversal down from a six-week bull micro channel is typically minor. It might last a few weeks, but the bulls will expect a higher low. They will look to buy at around a 50% retracement of the six-week rally. If this is the start of a swing down, traders should look for a higher low to form at around 2600 within a few weeks.
Remember, the E-mini is in a 2.5-year trading range. Traders therefore expect reversals, even when legs up or down are strong.
The E-mini has rallied strongly for six weeks. There are now three clear legs up (see daily chart below). That is a wedge rally and that typically attracts profit takers.
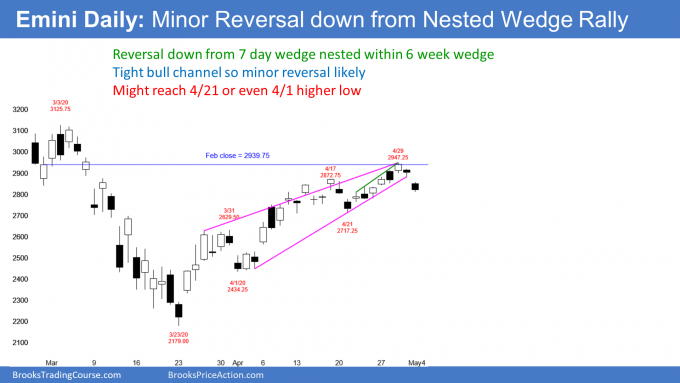
Also, if you look closely at the third leg up, it subdivided into three legs. On the 60-minute chart, you can see that these legs formed a wedge bull channel.
There is therefore a 60-minute wedge nested within a wedge on the daily chart. Nested patterns have a higher probability of working. Consequently, this week’s reversal down is probably the start of a two- to three-week sideways to down correction.
The six-week rally is in a tight bull channel. Even though the bull channel is a wedge, a tight bull channel is a strong bull trend. The first reversal down from a strong bull trend is usually minor. Therefore, even if there is a selloff that retraces half of the rally, the bulls will buy it. They will expect at least a second leg sideways to up. The second rally usually tests the top of the first rally.
Wedge top needs second reversal down
There is one more important point about wedge tops. When there is a wedge top in a strong bull trend, in general, there is a 50% chance that there will be one more brief new high before a successful reversal down begins. Thursday’s and Friday’s selloff have reduced that to 40%.
Remember, April is a buy signal bar on the monthly chart. May still might have to go above the April high. That would result in one more new high in the wedge on the daily chart. But if there is a break above the April high, traders will watch for a second sell signal. A second signal has a higher probability of leading to a two- to three-week pullback.
Trading range for remainder of 2020
If the reversal down has begun or if it stars within a few weeks, can it continue down to below the March low? There is only a 30% chance of that. The E-mini will probably continue in the 2.5-year range for the rest of the year.
When there is a reversal down in a trading range, the selloff typically falls below important support. The second leg up in the wedge rally broke above the March 31 high. That was the top of the first leg. The April 21 higher low did not overlap that high. There is therefore a gap above the March 31 high.
Gaps are common in strong trends. Since this rally is in a trading range, the gap should close. That means that traders should expect the E-mini to fall to around 2600.
Wedge reversals often fall to the start of the wedge
When there is a reversal from a wedge top, the selloff often reaches the start of the wedge bull channel. That is the bottom of the first pullback. Here, that is the April 1 low of 2434.25.
If the E-mini gets there, it might take a couple months to reach it. Because that is very far below, the current leg down will probably not get there. There will probably be a higher low and another leg up in the 2.5-year trading range first. But since the chart is in a trading range, the E-mini will probably get there at some point this year.
It’s a trading range, so trade it like a trading range
For the next couple months, the E-mini will probably stay within the 2600 – 2900 range. That trading range is within the 2.5-year range from 2200 to 3400.
One of the difficulties in trading ranges is that everything is less clear. Good tops and bottoms fail and the legs up and down often go farther than what looks reasonable.
Also, the legs up look most bullish just before reversing down and the legs down look most bearish just before reversing up. It is important to avoid the temptation of buying high or selling low, hoping for a new trend.
In addition, trade the chart that is in front of you and not the one you hope it becomes. Do not be upset by the reversals. They can be good opportunities for traders but are miserable for traders hoping for sustained trends.
The six-week reversal up was so strong that the March low will probably remain the low for the year. But the reversal down in February was also very strong. Any rally this year should form a lower high.
Trading Room
Traders can see the end of the day bar-by-bar price action report by signing up for free at BrooksPriceAction.com. I talk about the detailed E-mini price action real-time throughout the day in the BrooksPriceAction.com trading room. We offer a two-day free trial.


