

The euro currency continues to swing wildly but won’t pick a direction, reports Al Brooks.
The EURUSD currency pair has been in a sideways range for eight weeks. It is in Breakout Mode. This past week’s bull bar slightly increases the chance of higher prices next week.
The EURUSD weekly chart (see below) has had many dramatic reversals since February. It has been in a bear channel for two years and in a trading range for eight months.
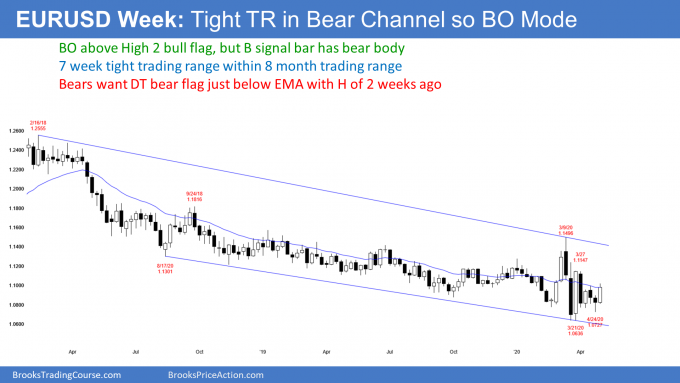
A trading range is a Breakout Mode pattern. The is a 50% chance of a bull breakout and a 50% chance of a bear breakout. Additionally, there is a 50% chance that any breakout will fail.
The EURUSD is in the lower half of both the bear channel and the trading range on the weekly chart. Also, the most recent strong move was the rally from the March 23 low. These factors slightly increase the probability that the next move will be up. However, until there is a breakout, there is no breakout. Traders see the weekly chart as neutral.
By going above last week’s high, the EURUSD triggered a High 2 buy signal. But the buy signal bar last week was a bear bar. Also, there were two consecutive bear bars. That is a weak buy setup. However, this week closed near its high. That slightly increases the chance of higher prices next week.
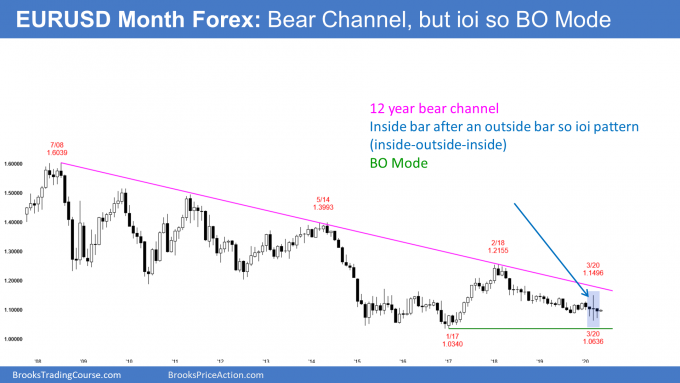
On the monthly EURUSD chart, the April low was above the March low. Also, the April high was below the March high (see below). April was therefore an inside bar. That is a one bar Breakout Mode pattern. In addition, March was huge and it was an outside bar. There is now an inside-outside-inside (IOI) Breakout Mode pattern on the monthly chart.
After one day, May is currently inside of April. That means consecutive inside bars (ii), which is another Breakout Mode pattern.
Since the past three months were all dojis, the pattern is more neutral. That reduces the chance of a strong breakout into a trend.
Furthermore, the monthly chart has been sideways for eight months. Markets have inertia. They tend to continue to do what they have been doing. Therefore, traders expect more sideways trading.
What happens if May breaks above or below April’s range? Most likely, not much. Trading ranges resist breaking out. Consequently, a move out of April’s range will have a hard time lasting more than a month or so. The EURUSD will probably continue sideways indefinitely.
Everyone knows that there will eventually be a breakout into a trend. But until there are consecutive big trend bars, traders will continue to look for reversals.
Trading Room
Traders can see the end of the day bar-by-bar price action report by signing up for free at BrooksPriceAction.com. I talk about the detailed E-mini price action real-time throughout the day in the BrooksPriceAction.com trading room. We offer a two-day free trial.


