

Patterns in Healthcare stocks and their year-to-date performance from Suri Duddella.
As blitz of innovation for Covid-19 pandemic vaccines and medical solution are underway, the Healthcare industry is showing promising signs of continuation of its trend from 2019 in 2020. The Healthcare sector is also growing significantly globally. Healthcare stocks primarily consists of Pharmaceutical companies, Biotech companies, medical device companies, Healthcare provider companies and Pharmacy benefits management (PBMs). In addition, aging demographic trends across the world combined with advances in technology, healthcare should provide great opportunities for investors.
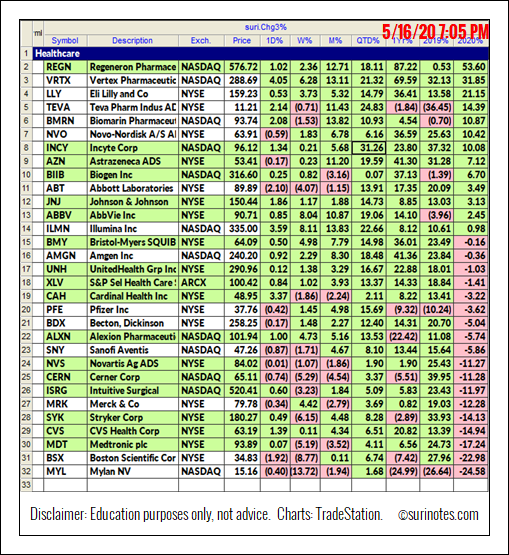
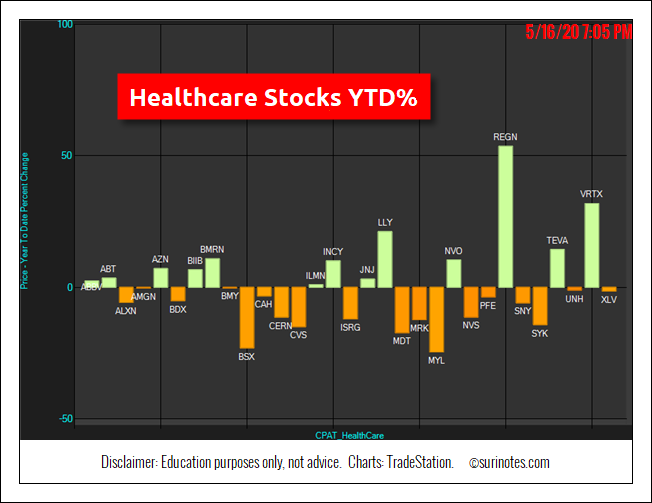
Here is a list of Healthcare stocks and their year-to-date performance:
Cup & Handle Patterns
The Cup and Handle Chart pattern was developed and popularized by William J. O’Neil in the 1980s through his CANSLIM methodology described in Investor’s Business Daily and his book "How to Make Money in Stocks."
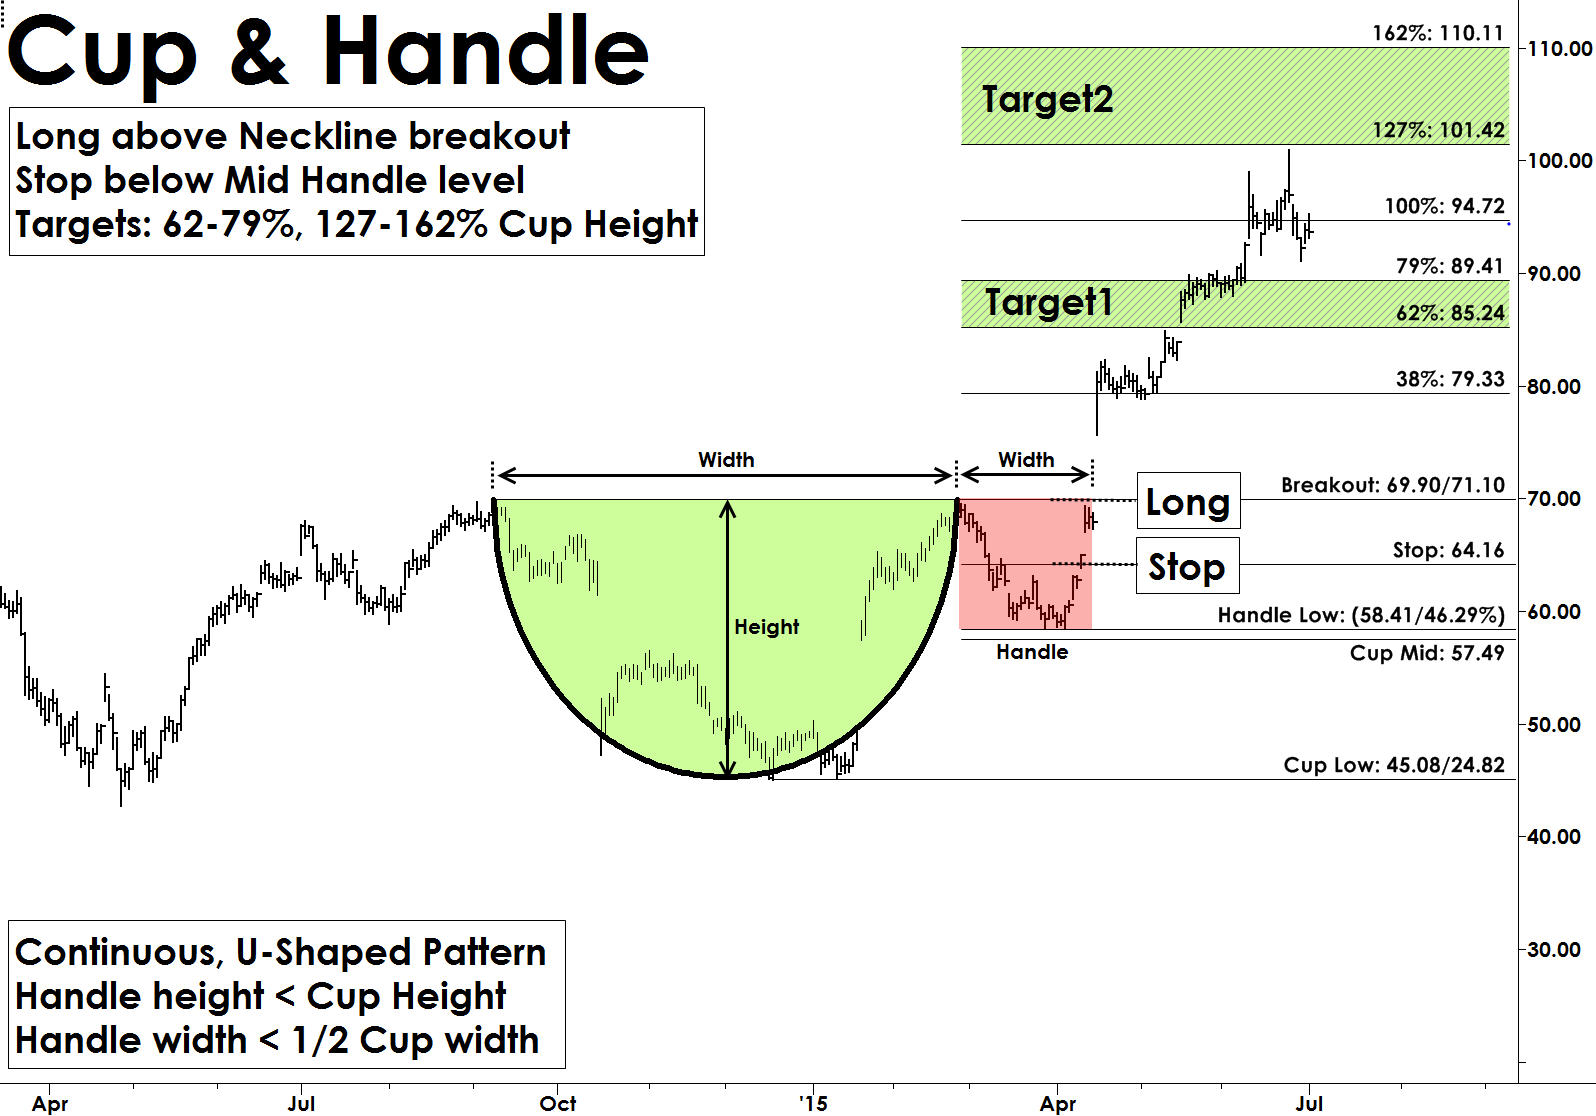
Cup and Handle pattern resembles a cup with a handle. Cup and Handle patterns are continuation patterns, and they usually form in bullish trends. Most Cup and Handle patterns are very reliable and offer great trading opportunities. They also form in all markets and in all time-frames. The “Cup” formation is developed as consolidation phase during price rallies from the round bottom formation over multiple weeks to months. The “Handle” part forms due to a price correction after “Cup” formation and before a clear breakout to the upside.
Cup and Handle pattern structure show the momentum pause after reaching a new high in a U-Shape form, followed by another attempt to breakout. When this breakout from the rim of the cup fails it starts to fall back to build the handle structure. Usually, the handle structures are small, and the handle depth should not exceed more than 50% of cup depth. This handle part of the pattern generates interest in buyers as they expect the pattern to breakout from these levels. The pattern is valid only if price convincingly breaks out with increased volume above the rim of the cup levels (see chart).
Amgen Inc. Cup & Handle Pattern
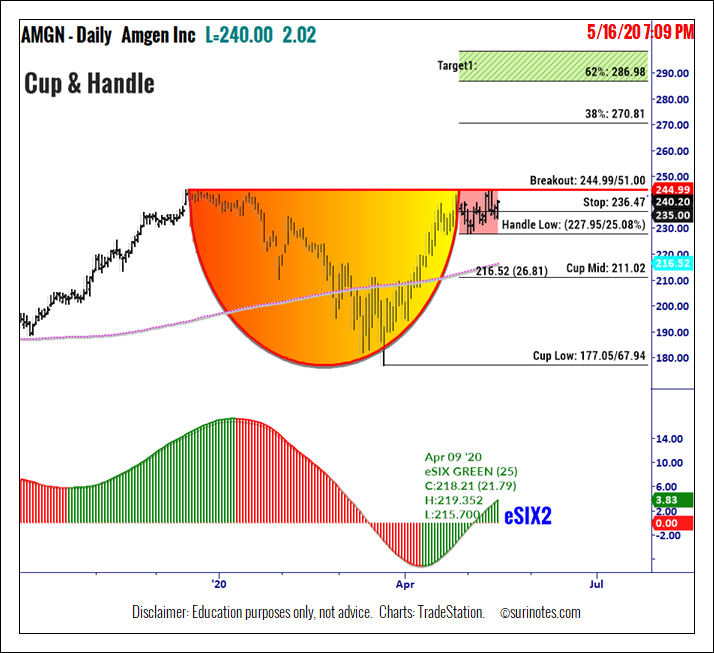
The following daily chart shows the Amgen Inc. (AMGN) with a Cup & Handle pattern formed from December 2019 to May l 2020 and trading near breakout level at $245 as it forms the handle structure. Cup & Handle Patterns are valid only when price closes above the breakout level. AMGN breakout level: $245.09, mid-cup Level: $211.02, a stop is set below $236.40. Targets are placed from $287 and 298.40.
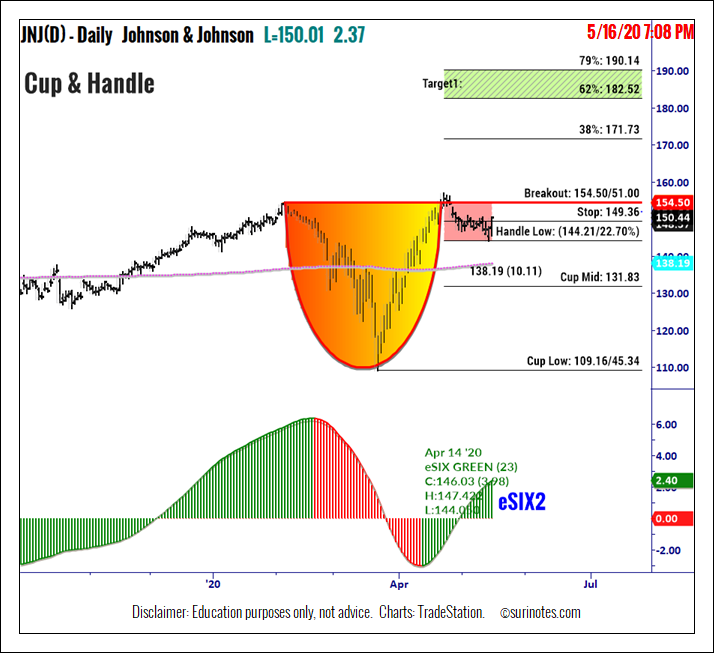
Johnson & Johnson
The following daily chart shows Johnson & Johnson (JNJ) with a Cup & Handle pattern. JNJ formed a C&H pattern from January 2020 to May 2020 and is trading near breakout level $154.50 as it forms the handle pattern. C&H Patterns are valid only when price closes above the breakout level. The JNJ breakout level is $154.60, mid-cup Level is $131.83, stop is below $149.36 with targets at $182.50 and $190.10.
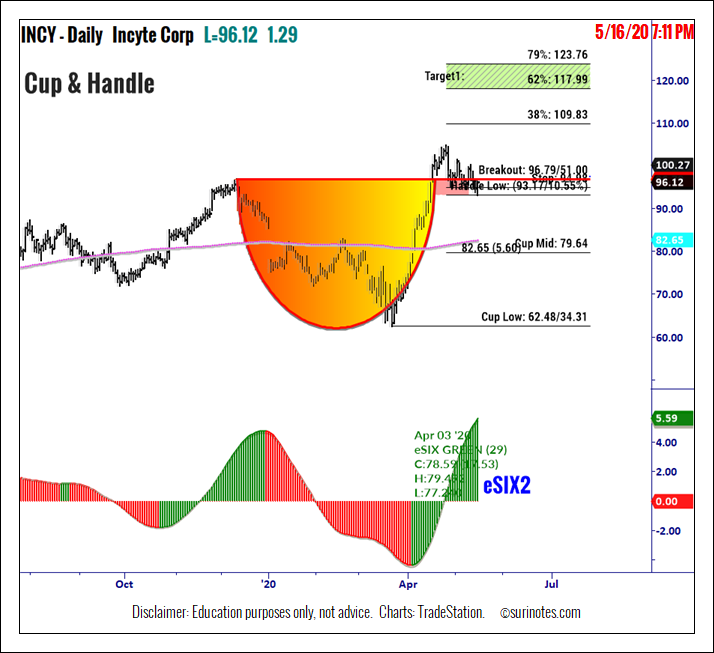
Incyte Corp. Pattern
The following daily chart shows Incyte Corp. (INCY) daily chart with a Cup & Handle pattern. INCY formed a C&H pattern from December 2019 to May 2020 and trading near breakout level of $96.79 as it forms the handle pattern. C&H Patterns are valid only when price closes above the breakout level. INCY breakout level is $96.89, the mid-cup level is $79.64, and stop is set below $93. Targets are $118.0 and $123.8 (see chart).
Find more of Suri’s work at surinotes.com.


