

Stocks and safe havens are struggling to find a direction, reports Marvin Appel
On June 11th the stock market crashed, with the S&P 500 losing almost 6%. Since then the index has regained more than 3%. The ostensible cause of the crash was the recent uptick in U.S. Coronavirus cases in the south and west.
Last week, it was reported that initial U.S. jobless claims at 1.5 million were slightly worse than expected, although this figure is the least bad reading in 11 weeks. This news didn’t nudge the market in either direction.
June has been a month of consolidation after a big stock market recovery in April and May. Although the intermediate-term trend remains up, the near-term outlook is for a volatile but overall sideways market staying close to the 200-day moving average. The SPDR S&P 500 ETF Trust (SPY) has been one of the stronger U.S. equity exchange-traded funds, remaining above its 200-day moving average and its middle Bollinger band (see chart below).
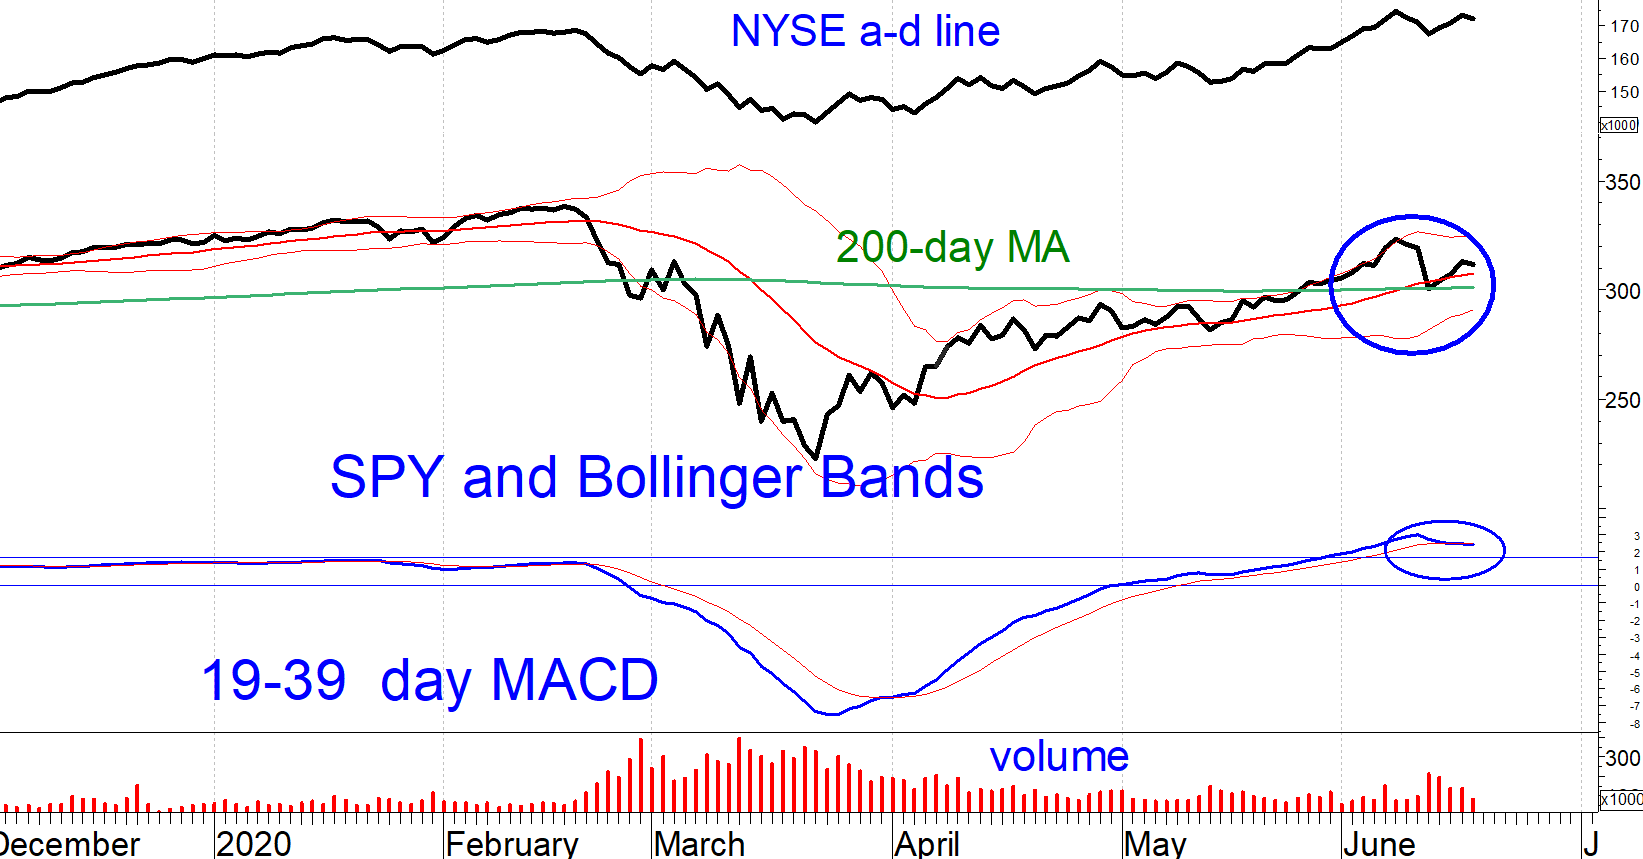
However, its Moving Average Convergence/Divergence (MACD) indicator recently generated a sell signal from an overbought level (circled in the bottom of the chart).
This is bearish and contradicts our intermediate-term bullish signal. This inconsistency, along with the observation that the 200-day moving average and middle Bollinger bands have been support levels this month, leads me to expect a pause in the March 23 to June 8 rally, but without a significant correction in the rest of the month. Of course, from June 8 to June 11 SPY fell 7%, so in this environment, even a short correction is very risky.
As a result, we continue to maintain our clients’ portfolios with less than their allocated equity positions even though our equity timing models are on buy signals. I continue to recommend covered call writing with SPY, where at-the-money calls that expire in a month generate approximately 3% in time value.
U.S. dollar appears poised to fall
The past seven months have seen outsized volatility in the U.S. dollar. The dollar briefly spiked in March as a safe haven currency as the Coronavirus pandemic exploded. However, in the past month, it has retested this year’s lows. One explanation for the dollar’s weakness is that the Federal Reserve has been much more aggressive than other central banks in printing money (see chart below).
There appears to be a lot more room for decline. The chart shows that the exchange-traded fund, the Invesco DB US Dollar Index Bullish Fund (UUP) that tracks the strength of the U.S. dollar compared to a basket of other major currencies is still at the top of its historical range. In addition, MACD has generated a sell signal confirmed by a negative divergence (circled).
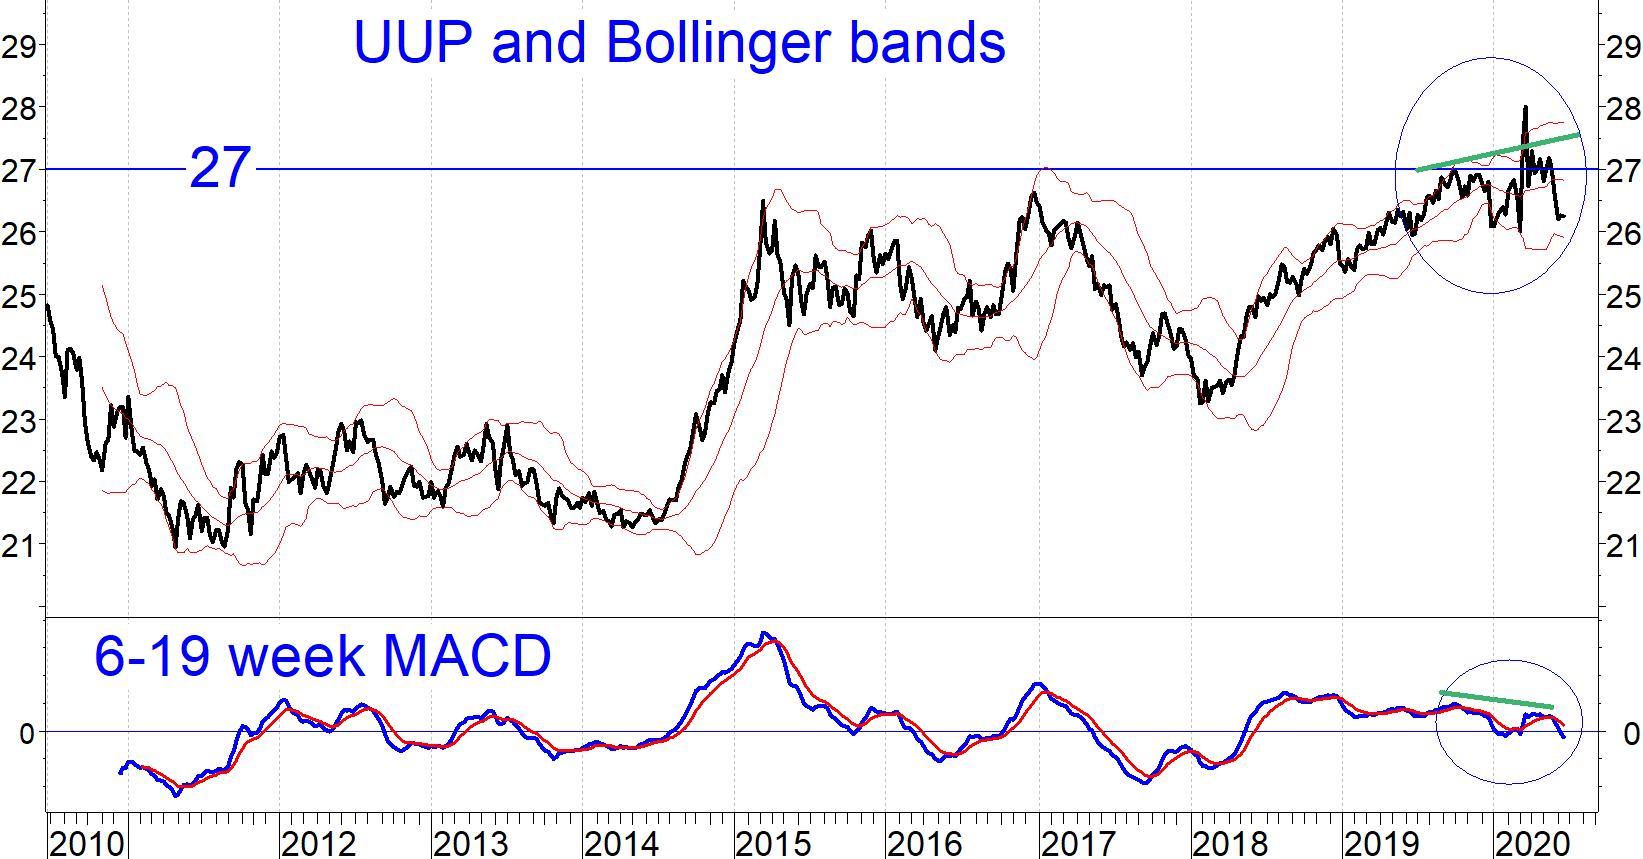
I do not recommend trading UUP on its own because the absence a strong longer-term trend makes limits the profit potential more than it limits the risk. However, the chart strongly suggests that currency exchange rates are going to be a tailwind for foreign equities in the months ahead.
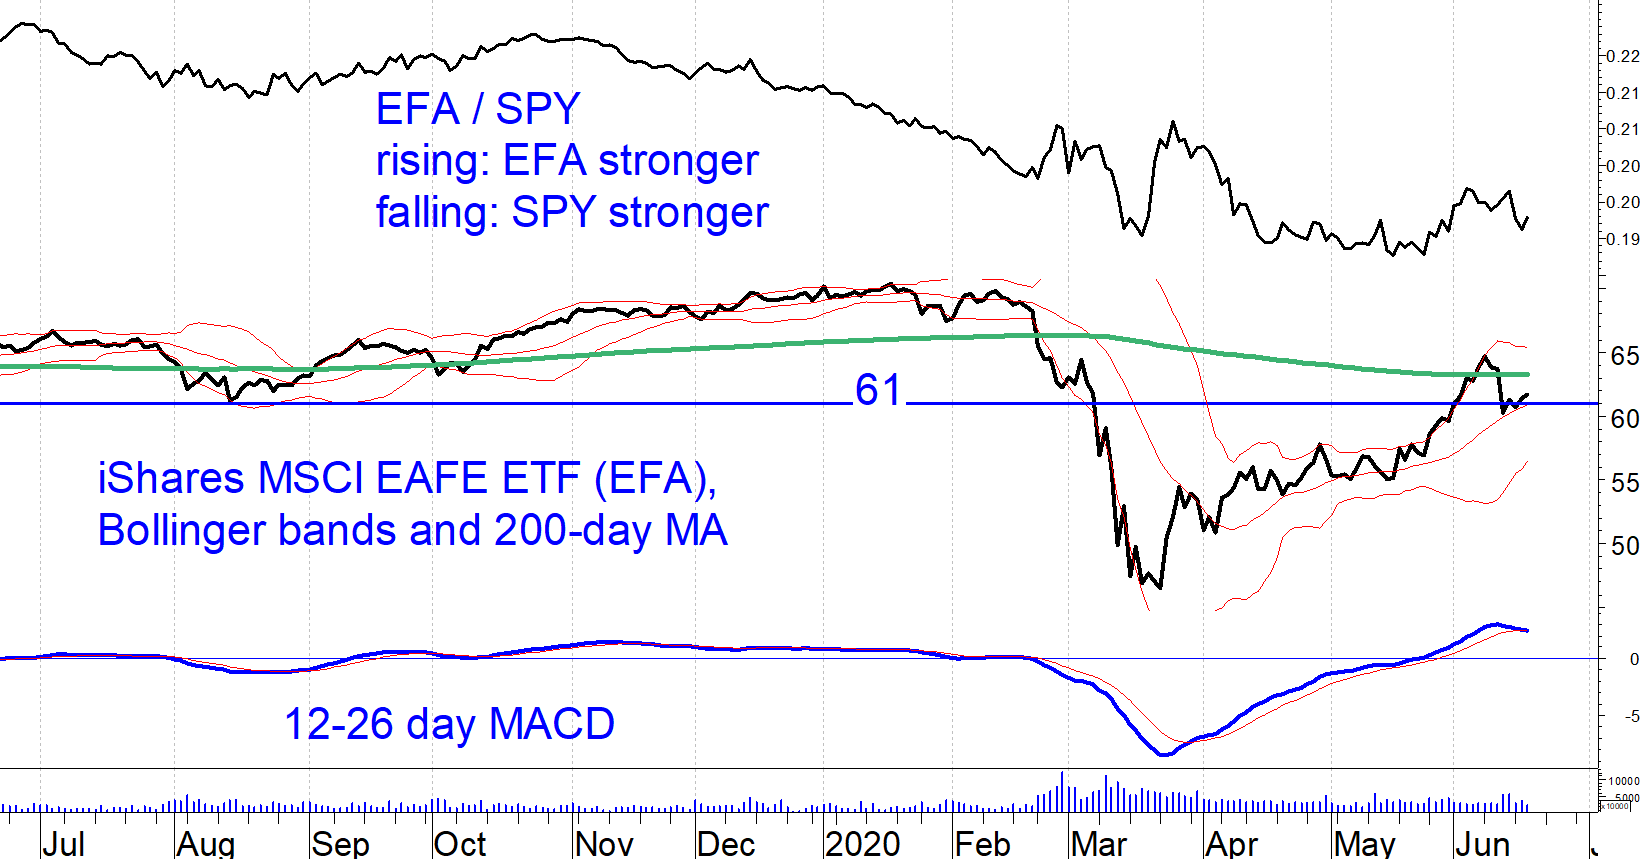
We are already seeing this reflected in recent strength in the iShares MSCI EAFE Index ETF (EFA), which reflects mostly European and Japanese stocks. EFA has been in a trend of lagging SPY since late 2007. Indeed, unlike SPY, EFA remains below its 200-day moving average. However, in the past month, the EFA/SPY ratio has increased, reflecting stronger performance by EFA (see chart below).
As a side note, EFA is yet another ETF that has consolidated near its 200-day moving average.
Implications
I do not generally recommend investing in foreign equity ETFs because the trend favoring SPY over other contenders such as EFA and EEM has been very strong over the past 12 years. However, if you are considering investing abroad based on other considerations, now appears to be as good a time as any to take advantage of a potential currency tailwind.


