

Bonds are in a breakout mode and could test highs, but won’t get much further, writes Al Brooks.
U.S. 30-year Treasury bond futures has a High 1 bull flag on the monthly chart, but it is in a tight trading range (see below). July should trade at least a little higher.
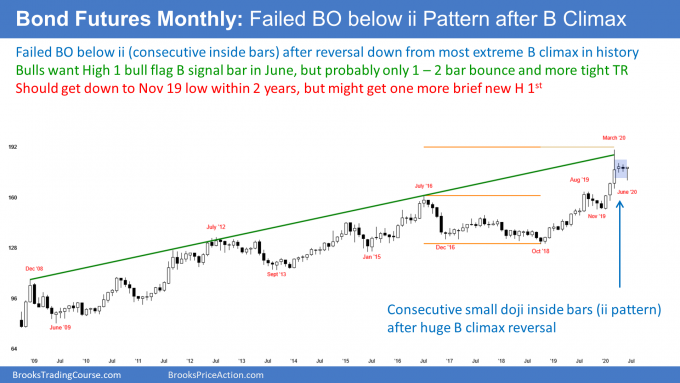
The 30-year bond futures formed consecutive inside bars on the monthly chart in April and May. This is an inside-inside (II) pattern. April’s high was below the March high and its low was above the March low. May was then inside of April’s range.
This is a Breakout Mode pattern. That means it is equally likely to lead to a rally or a selloff. Also, the first breakout fails half of the time.
The bond futures sold off below the ii pattern in June. However, it is now back at the high of the month. If June closes around here, traders will conclude that the bear breakout failed. Furthermore, June with be a High 1 bull flag buy signal bar on the monthly chart.
The bulls hope for a new high. But even if they get one, it will probably be brief. The bond market should work down to the November 2019 low within a couple years. That is the bottom of the most recent buy climax and is a magnet once there is a reversal down.
Reversal down from extreme buy climax
The most important feature on the monthly chart is the January to March buy climax. That was the most extreme buy climax in the history of the bond market. March reversed down and closed in the middle of its range.
After a reversal from a buy climax, traders look for a pause. Exhausted bulls take profits and then typically wait for about 10 bars before buying again. They want to give the bears a couple opportunities to reverse the trend before buying aggressively again.
Sometimes, however, there is one more buy climax before the reversal down begins. That is what traders are now deciding. Will this month lead to one more new high and then a reversal down? Or, will there be a brief rally to a lower high for a couple months and then a swing down to the November 2019 buy climax low?
We will find out this summer. If June closes near its high on Tuesday, it will make higher prices likely in July.
Trading Room
Traders can see the end of the day bar-by-bar price action report by signing up for free at BrooksPriceAction.com. I talk about the detailed E-mini price action real-time throughout the day in the BrooksPriceAction.com trading room. We offer a two-day free trial.


