

After three up months, the long euro bear trend may have ended, reports Al Brooks.
The EURUSD currency pair has rallied in a wedge bull channel to the March high on the weekly chart. But even if the bulls break above the March high, the EURUSD will probably be in a trading range for the next year. The top of the range should be around 1.18, corresponding to the September 2018 high, which was the start of the two-year bear channel.
The EURUSD currency pair has rallied for two weeks after forming an Inside-Inside (II) bull flag in early July on weekly chart (see below). An II pattern is a pair of consecutive inside bars. It is a Breakout Mode pattern. Since the breakout has been to the upside, it is an II bull flag.
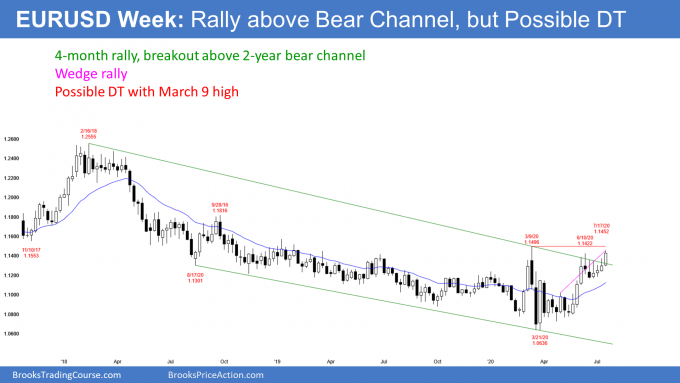
The breakout above the June high is good for the bulls. They want the rally to break above the March high. Not only that, they want consecutive closes above the March high. They would prefer those closes to be far above that high. If they succeed, traders will conclude that the 2017 bull trend is resuming.
Possible wedge rally to a double top
The EURUSD Forex market rallied strong in late March. The top of the March 27 big bull bar might be the first leg up in a wedge rally. June 10 is a possibly second leg. This coming week could be the third and final leg of the wedge bull channel. If the bears get a reversal down in the next couple weeks, it will be from a wedge rally on the daily chart.
Also, the July rally would then be a double top with the March high. It is important to note that the second leg up in a double top often is a wedge rally. There is then both a double top and a wedge top. That has a higher probability of leading to a two- to four-week selloff. Furthermore, if there is a selloff, it will probably have at least a couple legs down and test the bottom of the June/July trading range around 1.1150.
Trading range more likely than a bull trend
There is a 30% chance of the bulls achieving their goal of resuming the 2017 bull trend. Why is it not higher? Because the two-year bear trend was a Spike and Channel pattern on the monthly chart (see below).
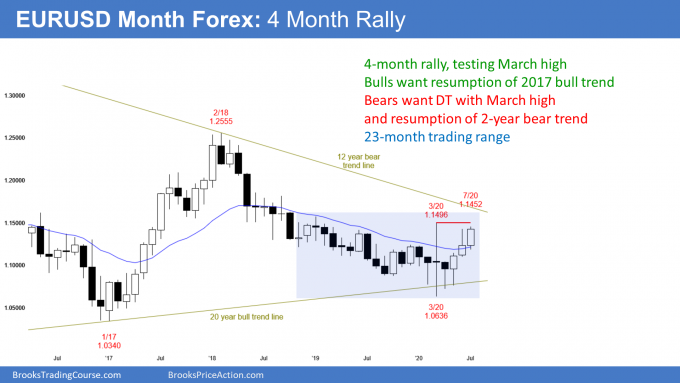
The channel began with the September 2018 high just above 1.18. When there is a reversal up from a Spike and Channel bear trend, the rally typically tests the start of the bear channel and then the rally stalls. Traders expect a trading range for many bars afterwards.
This means that the two-year bear channel will probably be simply a bear leg in a three- to five-year trading range. It also means that the current rally will probably be a bull leg in that same trading range. Finally, the trading range will probably last many months after it tests the September 2018 high, if it gets there.
Has the two-year bear trend ended? After three consecutive months that have traded above the high of the prior month, it probably has. The bear trend can resume, or the four-month rally could be the start of a bull trend. But because of the Spike and Bear Channel, the EURUSD monthly chart will probably be sideways for at least another year.
Trading Room
Traders can see the end of the day bar-by-bar price action report by signing up for free at BrooksPriceAction.com. I talk about the detailed E-mini price action real-time throughout the day in the BrooksPriceAction.com trading room. We offer a two-day free trial.


