

The QuantCycles Oscillator is showing a sell signal in coffee, which matches long-term seasonal tendencies, reports Daniel Collins.
There is a seasonal tendency in coffee futures to rally into the winter on scares of a potential freeze. Of course, the main region for coffee futures (The ICE U.S. Coffee futures contract, which is made up of Arabica coffee) is South America, specifically Brazil.
Our summer is their winter. So, right now is the primary period for a freeze risk.
Coffee had a sell-off in the spring, followed by a narrow range in June and has rallied sharply in July (see daily chart below).
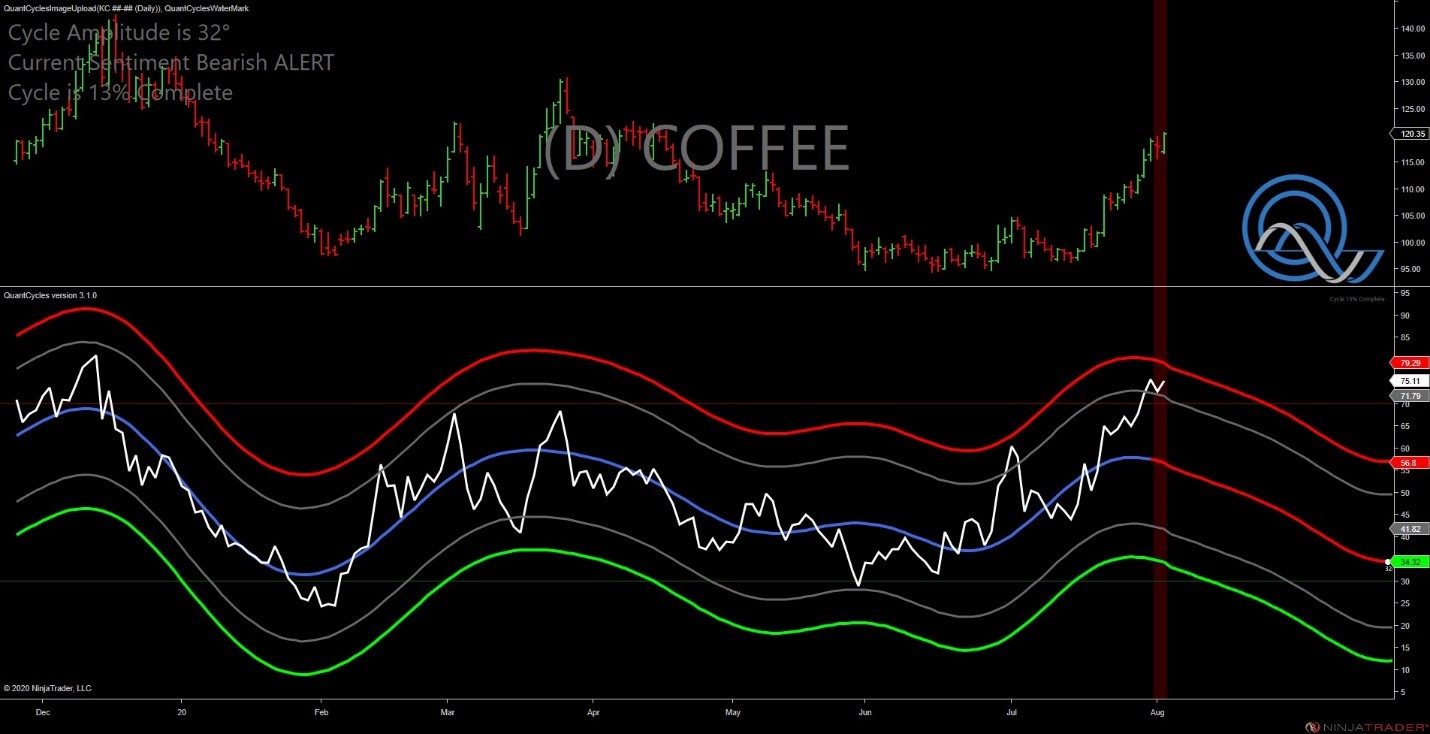
As you can see, the daily QuantCycles Oscillator for coffer recently turned bearish as it neared overbought territory. It projects weakness over the next 30 days.
The strength of this technical sell signal is enhanced by traditional seasonal tendencies as coffee typically rallies in July and into August on fears of a freeze, which seldom come, so the winter gains are soon lost.
The weekly oscillator indicates a smaller window to profit (see chart below).
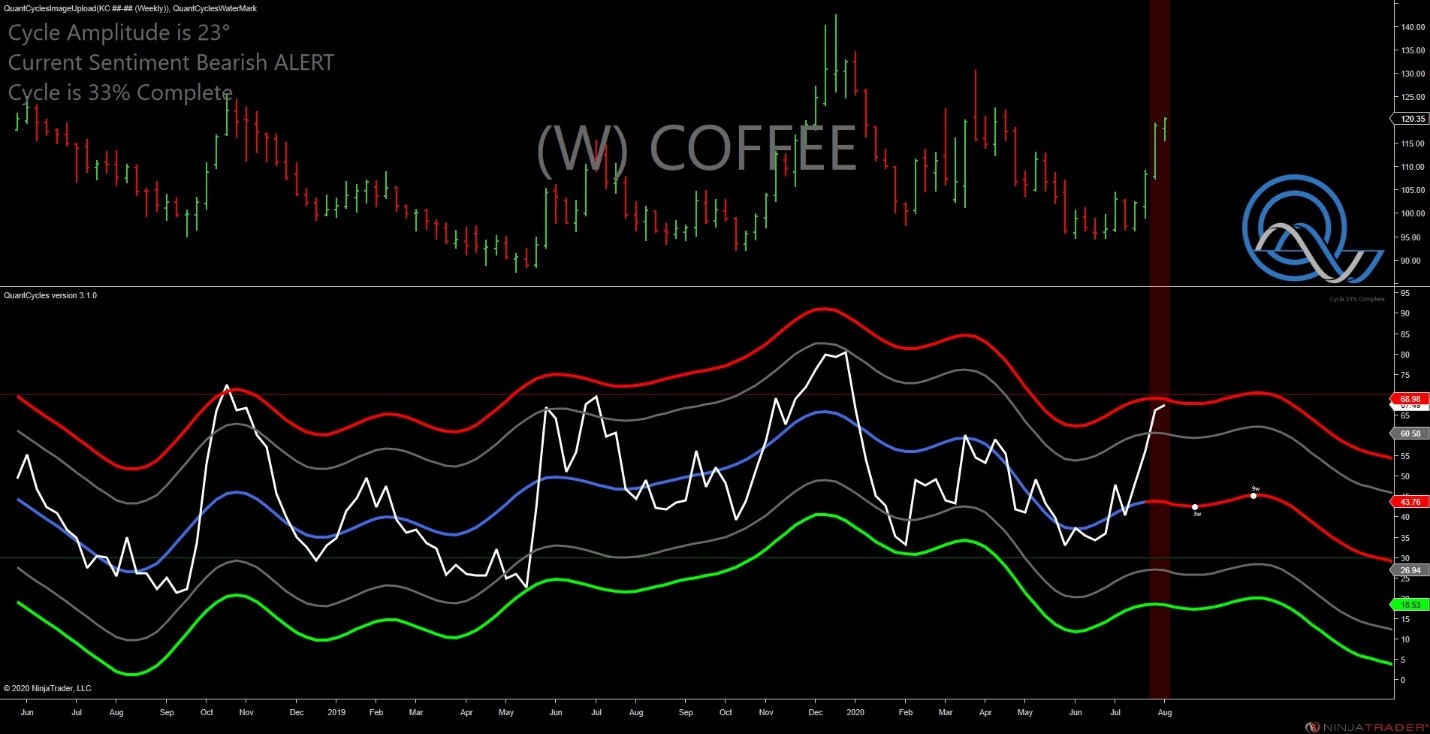
As you can see, the recent rally has pushed the long-term oscillator near extreme overbought territory. It projects weakness for three weeks before a brief and shallow rebound, which would the be followed by a deeper sell-off.
We suggest shorting coffee in expectation of a three-week sell-off. Take profits and/or include tight stops after three weeks. This could grow into a longer term trade if the expected rebound at the end of August is shallow.
Whirlpool Recap
Last Thursday we noted that appliance maker Whirlpool (WHR) had turned bearish in all QuantCycle timeframes just as it was hitting extreme overbought territory. We saw this as a flashing sell signal.
Well, WHR did sell-off briefly Thursday morning, but then resumed its uptrend. This has left it in the same position vis-à-vis the QuantCycles Oscillator—extremely overbought and pointing lower (see updated Daily and weekly charts below).
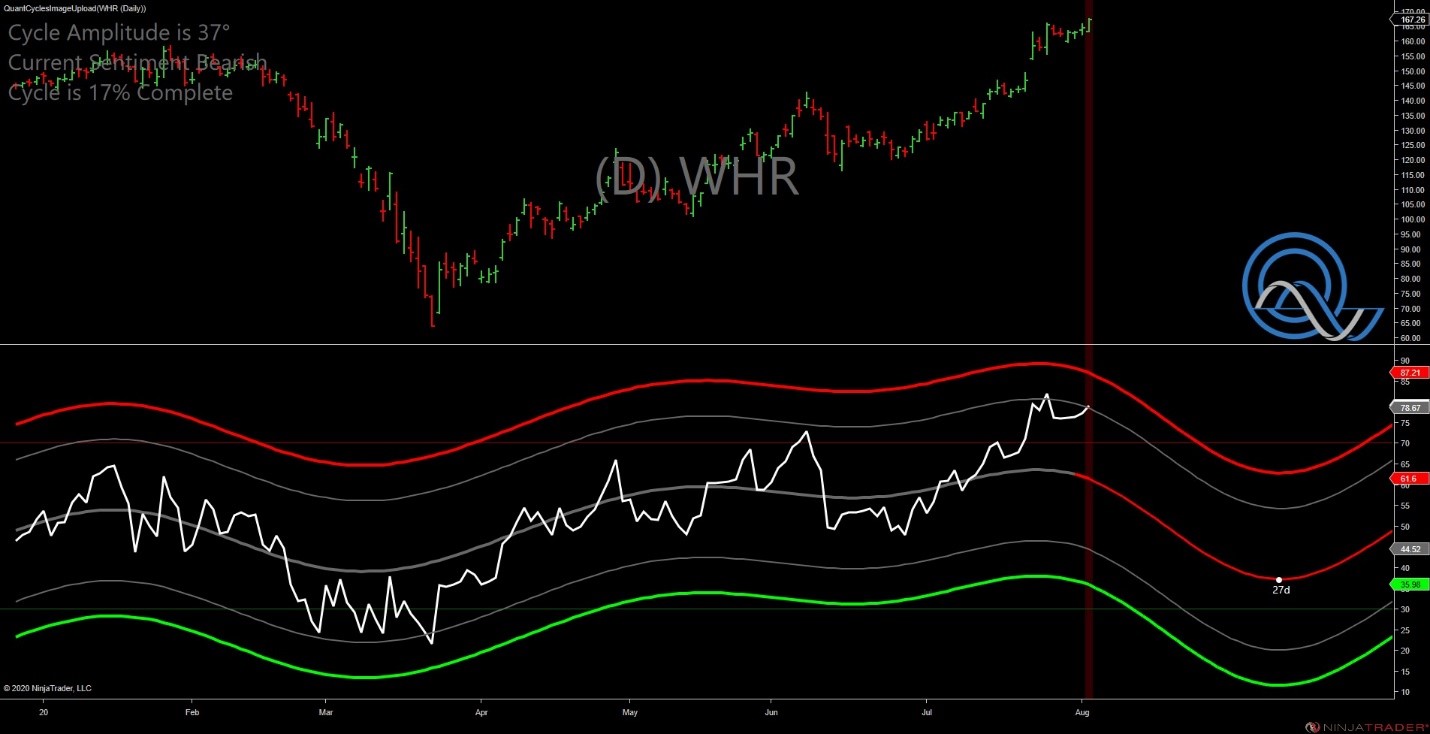
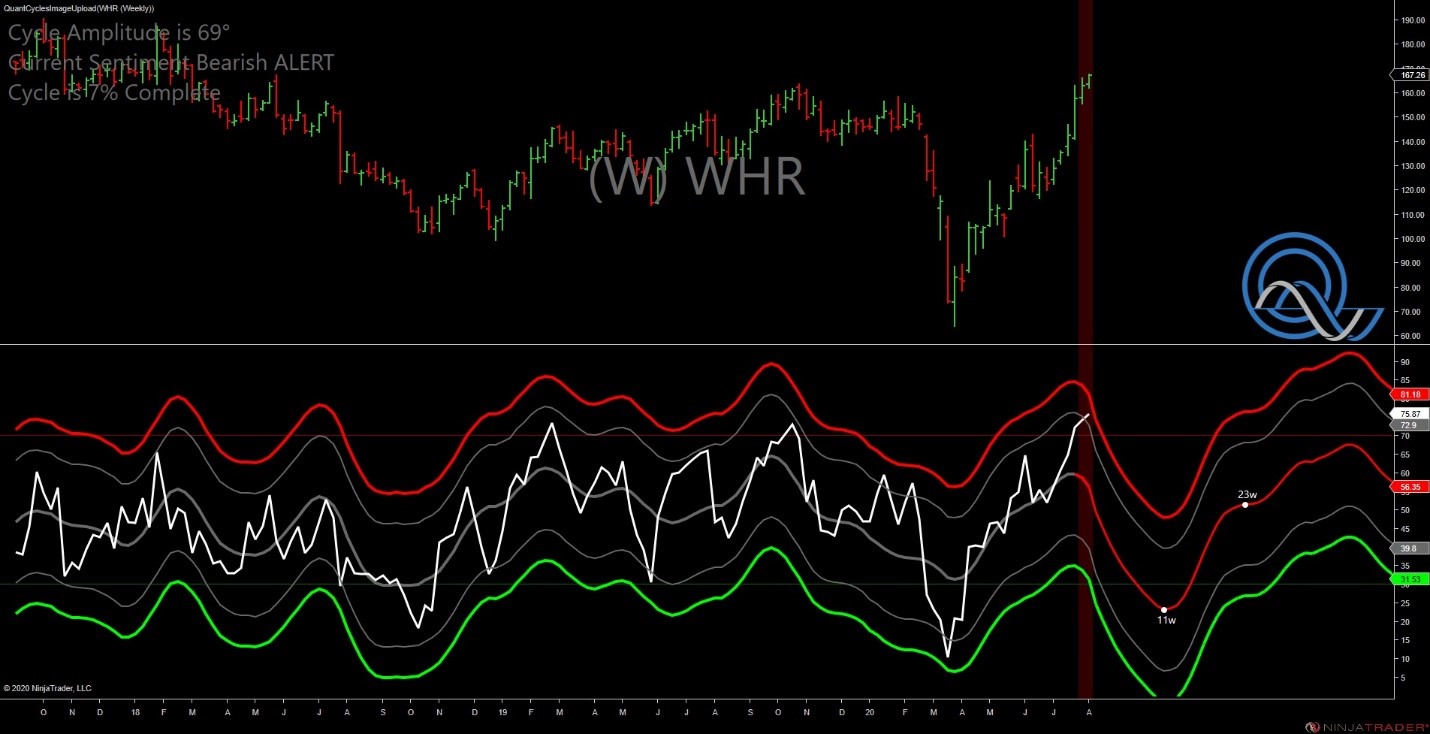
You can see that the daily oscillator has just turned down and the strength of the last week has pushed the weekly further into overbought territory as it stares into a huge downward move.
When we wrote the piece last week, we saw this as strong evidence of a downturn. However, the four-hour chart had already turned lower and included a brief bearish window before turning up. That forecast appears to have been spot on as WHR quickly rebounded (see chart below).
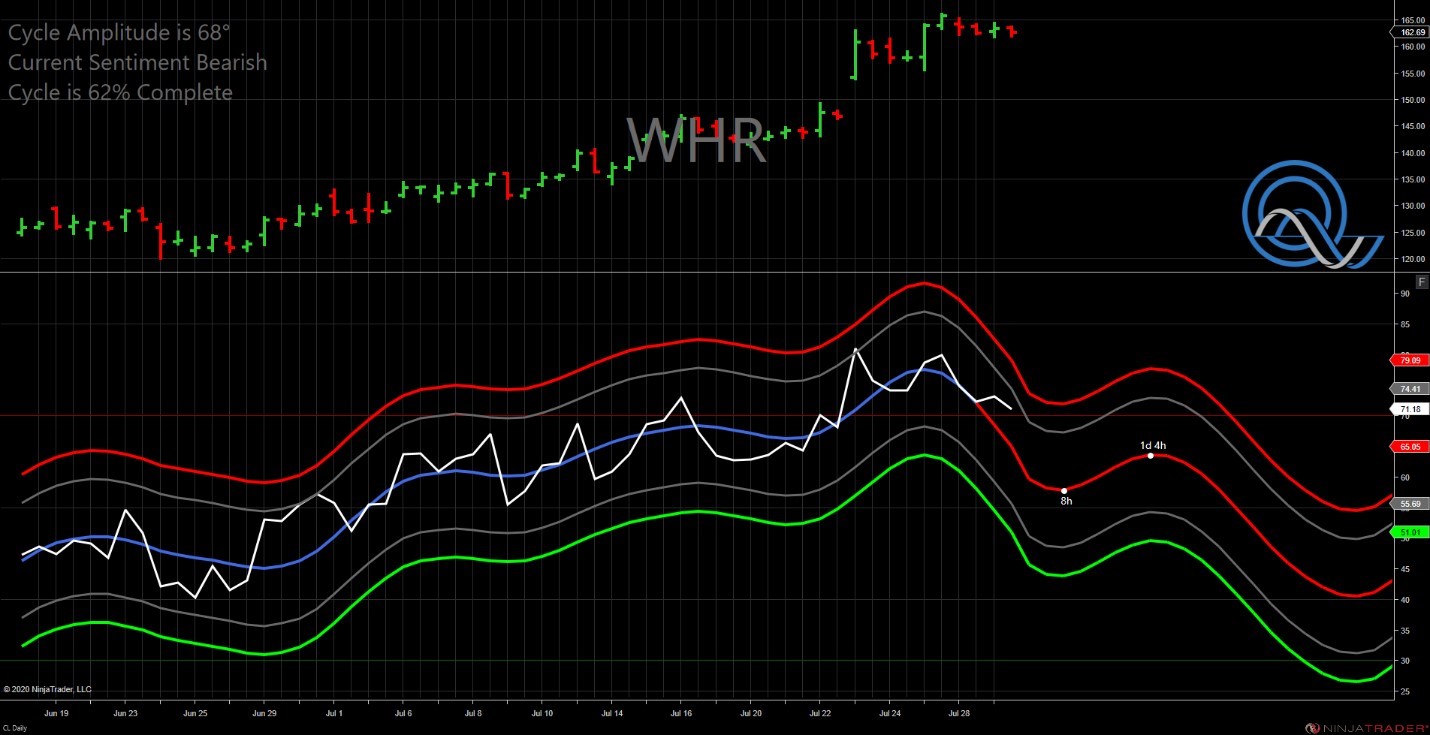
This four-hour chart from last week has not been updated. This means that it correctly saw the Thursday weakness and the resultant rebound and is now once again pointing lower.
Our bearish outlook remains intact.
John Rawlins described the value of the QuantCycles Oscillator recently at The Orlando MoneyShow.
The QuantCycles indicator is a technical tool that employs proprietary statistical techniques and complex algorithms to filter multiple cycles from historical data, combines them to obtain cyclical information from price data and then gives a graphical representation of their predictive behavior (center line forecast). Other proprietary frequency techniques are then employed to obtain the cycles embedded in the prices. The upper and lower bands of the oscillator represent a two-standard deviation move from the predictive price band and are indicative of extreme overbought/oversold conditions.


